• Skip to primary navigation
  • Skip to main content
  • Skip to primary sidebar
  • Skip to footer

RealClimate

Climate science from climate scientists...

  • Home
  • Start here
  • Contributors
  • Archives
You are here: Home / Archives for Climate Science / Oceans

Oceans

What drives uncertainties in adapting to sea-level rise?

17 Mar 2016 by Stefan

Guest article by Sally Brown, University of Southampton

Let me get this off my chest – I sometimes get frustrated at climate scientists as they love to talk about uncertainties! To be sure, their work thrives on it. I’m someone who researches the projected impacts and adaptation to sea-level rise and gets passed ‘uncertain’ climate data projections to add to other ‘uncertain’ data projections in my impact modellers work bag. But climate scientists do a good job. Without exploring uncertainties, science loses robustness, but uncertainties in combination can become unbounded and unhelpful to end users.

Let’s take an adaptation to sea-level rise as an example: With increasing scientific knowledge, acceptance and mechanisms that would allow adaptation to potentially occur, one would think that adaptation would be straight forward to implement. Not so. Instead of hard and fast numbers, policy makers are faced with wide ranges of uncertainties from different sources, making decision making challenging. So what uncertainties are there in the drivers of change, and can understanding these uncertainties enable better decisions for adaptation?

Prior to considering adaptation in global or regional models, or implementation at local level, drivers of change and their impacts (and thus uncertainties) require analysis – here are a few examples. [Read more…] about What drives uncertainties in adapting to sea-level rise?

Filed Under: Climate impacts, Climate Science, Oceans

Millennia of sea-level change

22 Feb 2016 by Stefan

How has global sea level changed in the past millennia? And how will it change in this century and in the coming millennia? What part do humans play? Several new papers provide new insights.

2500 years of past sea level variations

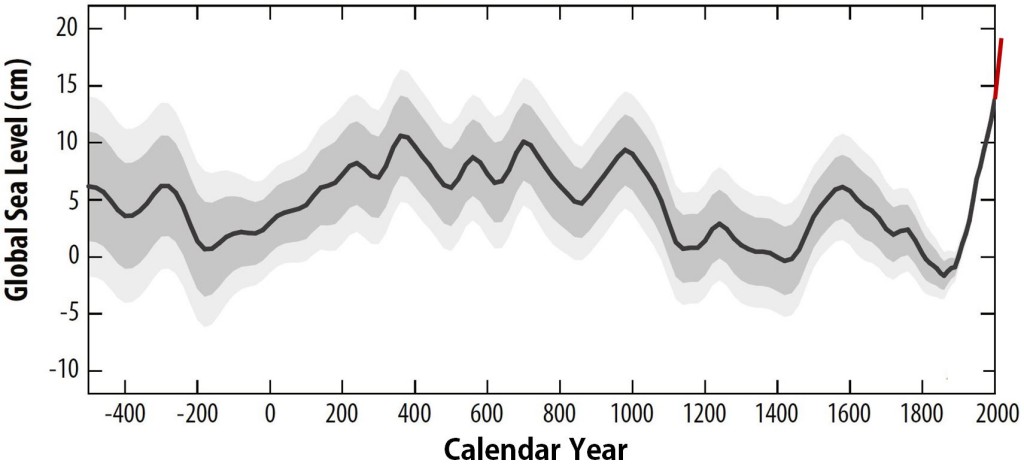
This week, a paper will appear in the Proceedings of the National Academy of Sciences (PNAS) with the first global statistical analysis of numerous individual studies of the history of sea level over the last 2500 years (Kopp et al. 2016 – I am one of the authors). Such data on past sea level changes before the start of tide gauge measurements can be obtained from drill cores in coastal sediments. By now there are enough local data curves from different parts of the world to create a global sea level curve.

Let’s right away look at the main result. The new global sea level history looks like this:

Kopp2016_Fig1a+sat

Fig. 1 Reconstruction of the global sea-level evolution based on proxy data from different parts of the world. The red line at the end (not included in the paper) illustrates the further global increase since 2000 by 5-6 cm from satellite data. [Read more…] about Millennia of sea-level change

References

  1. R.E. Kopp, A.C. Kemp, K. Bittermann, B.P. Horton, J.P. Donnelly, W.R. Gehrels, C.C. Hay, J.X. Mitrovica, E.D. Morrow, and S. Rahmstorf, "Temperature-driven global sea-level variability in the Common Era", Proceedings of the National Academy of Sciences, vol. 113, 2016. http://dx.doi.org/10.1073/pnas.1517056113

Filed Under: Arctic and Antarctic, Climate impacts, Climate modelling, Climate Science, Oceans, Paleoclimate

Blizzard Jonas and the slowdown of the Gulf Stream System

24 Jan 2016 by Stefan

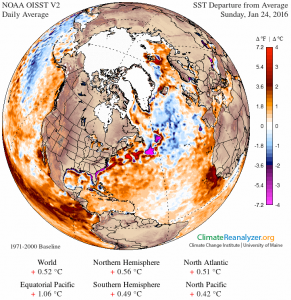
Blizzard Jonas on the US east coast has just shattered snowfall records. Both weather forecasters and climate experts have linked the high snowfall amounts to the exceptionally warm sea surface temperatures off the east coast. In this post I will examine a related question: why are sea surface temperatures so high there, as shown in the snapshot from Climate Reanalyzer below?


GFS-025deg_NH-SAT1_SST_anom_24_Jan_2016

I will argue that this warmth (as well as the cold blob in the subpolar Atlantic) is partly due to a slowdown of the Atlantic Meridional Overturning Circulation (AMOC), sometimes referred to as the Gulf Stream System, in response to global warming. There are two points to this argument:

[Read more…] about Blizzard Jonas and the slowdown of the Gulf Stream System

Filed Under: Climate Science, In the News, IPCC, Oceans

Reflections on Ringberg

1 Apr 2015 by Gavin

As previewed last weekend, I spent most of last week at a workshop on Climate Sensitivity hosted by the Max Planck Institute at Schloss Ringberg. It was undoubtedly one of the better workshops I’ve attended – it was focussed, deep and with much new information to digest (some feel for the discussion can be seen from the #ringberg15 tweets). I’ll give a brief overview of my impressions below.

[Read more…] about Reflections on Ringberg

Filed Under: Aerosols, Climate modelling, Climate Science, Greenhouse gases, Instrumental Record, IPCC, Oceans, Paleoclimate

A hypothesis about the cold winter in eastern North America + Update

30 Mar 2015 by Stefan

The past winter was globally the warmest on record. At the same time it set a new cold record in the subpolar North Atlantic – and it was very cold in the eastern parts of North America. Are these things related?

Two weeks ago NOAA published the following map of temperature anomalies for the past December-January-February (i.e. the Northern Hemisphere winter). One week ago, we published a paper in Nature Climate Change (which had been in the works for a few years) arguing that the cold in the subpolar North Atlantic is indicative of an AMOC slowdown (as discussed in my last post). Immediately our readers started to ask (as we indeed had been asking ourselves): does the cold winter in eastern North America (culminating in the Inhofe snowball incident) have anything to do with what is going on in the Atlantic?

Winter15NOAAFig. 1 Temperature anomaly map for the past december-january-february, from NOAA.

[Read more…] about A hypothesis about the cold winter in eastern North America + Update

References

  1. S. Rahmstorf, J.E. Box, G. Feulner, M.E. Mann, A. Robinson, S. Rutherford, and E.J. Schaffernicht, "Exceptional twentieth-century slowdown in Atlantic Ocean overturning circulation", Nature Climate Change, vol. 5, pp. 475-480, 2015. http://dx.doi.org/10.1038/nclimate2554

Filed Under: Climate impacts, Climate Science, Oceans

A new sea level curve

14 Jan 2015 by Stefan

The “zoo” of global sea level curves calculated from tide gauge data has grown – tomorrow a new reconstruction of our US colleagues around Carling Hay from Harvard University will appear in Nature (Hay et al. 2015). That is a good opportunity for an overview over the available data curves. The differences are really in the details, the “big picture” of sea-level rise does not change. In all curves, the current rates of rise are the highest since records began.

The following graph shows the new sea level curve as compared to six known ones.

haysl1

Fig 1 Sea level curves calculated by different research groups with various methods. The curves show the sea level relative to the satellite era (since 1992). Graph: Klaus Bittermann.

All curves show the well-known modern sea level rise, but the exact extent and time evolution of the rise differ somewhat. Up to about 1970, the new reconstruction of Hay et al. runs at the top of the existing uncertainty range. For the period from 1880 AD, however, it shows the same total increase as the current favorites by Church & White. Starting from 1900 AD it is about 25 mm less. This difference is at the margins of significance: the uncertainty ranges overlap. [Read more…] about A new sea level curve

References

  1. C.C. Hay, E. Morrow, R.E. Kopp, and J.X. Mitrovica, "Probabilistic reanalysis of twentieth-century sea-level rise", Nature, vol. 517, pp. 481-484, 2015. http://dx.doi.org/10.1038/nature14093

Filed Under: Climate Science, Instrumental Record, Oceans

Diagnosing Causes of Sea Level Rise

8 Jan 2015 by eric

Guest post by Sarah G. Purkey and Gregory C. Johnson,
University of Washington / NOAA

I solicited this post from colleagues at the University of Washington. I found their paper particularly interesting because it gets at the question of sea level rise from a combination of ocean altimetry and density (temperature + salinity) data. This kind of measurement and calculation has not really been possible — not at this level of detail — until quite recently. A key finding is that one can reconcile various different estimates of the contributions to observed sea level rise only if the significant warming of the deep ocean is accounted for. There was a good write-up in The Guardian back when the paper came out.– Eric Steig


Sea leave rise reveals a lot about our changing climate. A rise in the mean sea level can be caused by decreases in ocean density, mostly reflecting an increase in ocean temperature — this is steric sea level rise. It can also be caused by an increase in ocean mass, reflecting a gain of fresh water from land. A third, and smaller, contribution to mean sea level is from glacial isostatic adjustment. The contribution of glacial isostatic adjustment, while small, has a range of possible values and can be a significant source of uncertainty in sea level budgets. Over recent decades, very roughly half of the observed mean sea level rise is owing to changes in ocean density with the other half owing to the increased in ocean mass, mostly from melting glaciers and polar ice sheets. The exact proportion has been difficult to pin down with great certainty. [Read more…] about Diagnosing Causes of Sea Level Rise

References

  1. S.G. Purkey, G.C. Johnson, and D.P. Chambers, "Relative contributions of ocean mass and deep steric changes to sea level rise between 1993 and 2013", Journal of Geophysical Research: Oceans, vol. 119, pp. 7509-7522, 2014. http://dx.doi.org/10.1002/2014JC010180

Filed Under: Climate Science, Oceans

Ocean heat storage: a particularly lousy policy target + Update

20 Oct 2014 by Stefan

The New York Times, 12 December 2027: After 12 years of debate and negotiation, kicked off in Paris in 2015, world leaders have finally agreed to ditch the goal of limiting global warming to below 2 °C. Instead, they have agreed to the new goal of limiting global ocean heat content to 1024 Joules. The decision was widely welcomed by the science and policy communities as a great step forward. “In the past, the 2 °C goal has allowed some governments to pretend that they are taking serious action to mitigate global warming, when in reality they have achieved almost nothing. I’m sure that this can’t happen again with the new 1024 Joules goal”, said David Victor, a professor of international relations who originally proposed this change back in 2014. And an unnamed senior EU negotiator commented: “Perhaps I shouldn’t say this, but some heads of state had trouble understanding the implications of the 2 °C target; sometimes they even accidentally talked of limiting global warming to 2%. I’m glad that we now have those 1024 Joules which are much easier to grasp for policy makers and the public.”

This fictitious newspaper item is of course absurd and will never become reality, because ocean heat content is unsuited as a climate policy target. Here are three main reasons why. [Read more…] about Ocean heat storage: a particularly lousy policy target + Update

Filed Under: Climate Science, Instrumental Record, IPCC, Oceans

Going with the wind

17 Feb 2014 by group

A new paper in Nature Climate Change out this week by England and others joins a number of other recent papers seeking to understand the climate dynamics that have led to the so-called “slowdown” in global warming. As we and others have pointed out previously (e.g. here), the fact that global average temperatures can deviate for a decade or longer from the long term trend comes as no surprise. Moreover, it’s not even clear that the deviation has been as large as is commonly assumed (as discussed e.g. in the Cowtan and Way study earlier this year), and has little statistical significance in any case. Nevertheless, it’s still interesting, and there is much to be learned about the climate system from studying the details.

Several studies have shown that much of the excess heating of the planet due to the radiative imbalance from ever-increasing greenhouses gases has gone into the ocean, rather than the atmosphere (see e.g. Foster and Rahmstorf and Balmaseda et al.). In their new paper, England et al. show that this increased ocean heat uptake — which has occurred mostly in the tropical Pacific — is associated with an anomalous strengthening of the trade winds. Stronger trade winds push warm surface water towards the west, and bring cold deeper waters to the surface to replace them. This raises the thermocline (boundary between warm surface water and cold deep water), and increases the amount of heat stored in the upper few hundred meters of the ocean. Indeed, this is what happens every time there is a major La Niña event, which is why it is globally cooler during La Niña years. One could think of the last ~15 years or so as a long term “La-Niña-like” anomaly (punctuated, of course, by actual El Niño (like the exceptionally warm years 1998, 2005) and La Niña events (like the relatively cool 2011).

A very consistent understanding is thus emerging of the coupled ocean and atmosphere dynamics that have caused the recent decadal-scale departure from the longer-term global warming trend. That understanding suggests that the “slowdown” in warming is unlikely to continue, as England explains in his guest post, below. –Eric Steig

Guest commentary by Matthew England (UNSW)

For a long time now climatologists have been tracking the global average air temperature as a measure of planetary climate variability and trends, even though this metric reflects just a tiny fraction of Earth’s net energy or heat content. But it’s used widely because it’s the metric that enjoys the densest array of in situ observations. The problem of course is that this quantity has so many bumps and kinks, pauses and accelerations that predicting its year-to-year path is a big challenge. Over the last century, no single forcing agent is clearer than anthropogenic greenhouse gases, yet zooming into years or decades, modes of variability become the signal, not the noise. Yet despite these basics of climate physics, any slowdown in the overall temperature trend sees lobby groups falsely claim that global warming is over. Never mind that the globe – our planet – spans the oceans, atmosphere, land and ice systems in their entirety.

This was one of the motivations for our study out this week in Nature Climate Change (England et al., 2014)  With the global-average surface air temperature (SAT) more-or-less steady since 2001, scientists have been seeking to explain the climate mechanics of the slowdown in warming seen in the observations during 2001-2013. One simple way to address this is to examine what is different about the recent decade compared to the preceding decade when the global-mean SAT metric accelerated. This can be quantified via decade-mean differences, or via multi-decadal trends, which are roughly equivalent if the trends are more-or-less linear, or if the focus is on the low frequency changes.

[Read more…] about Going with the wind

References

  1. G. Foster, and S. Rahmstorf, "Global temperature evolution 1979–2010", Environmental Research Letters, vol. 6, pp. 044022, 2011. http://dx.doi.org/10.1088/1748-9326/6/4/044022
  2. M.A. Balmaseda, K.E. Trenberth, and E. Källén, "Distinctive climate signals in reanalysis of global ocean heat content", Geophysical Research Letters, vol. 40, pp. 1754-1759, 2013. http://dx.doi.org/10.1002/grl.50382
  3. M.H. England, S. McGregor, P. Spence, G.A. Meehl, A. Timmermann, W. Cai, A.S. Gupta, M.J. McPhaden, A. Purich, and A. Santoso, "Recent intensification of wind-driven circulation in the Pacific and the ongoing warming hiatus", Nature Climate Change, vol. 4, pp. 222-227, 2014. http://dx.doi.org/10.1038/nclimate2106

Filed Under: Climate modelling, Climate Science, El Nino, Instrumental Record, Oceans

The global temperature jigsaw

17 Dec 2013 by Stefan

Since 1998 the global temperature has risen more slowly than before. Given the many explanations for colder temperatures discussed in the media and scientific literature (La Niña, heat uptake of the oceans, arctic data gap, etc.) one could jokingly ask why no new ice age is here yet. This fails to recognize, however, that the various ingredients are small and not simply additive. Here is a small overview and attempt to explain how the different pieces of the puzzle fit together.

AR5_temp_obs

Figure 1 The global near-surface temperatures (annual values at the top, decadal means at the bottom) in the three standard data sets HadCRUT4 (black), NOAA (orange) and NASA GISS (light blue). Graph: IPCC 2013. [Read more…] about The global temperature jigsaw

Filed Under: Aerosols, Climate modelling, Climate Science, El Nino, Instrumental Record, Oceans, statistics

  • « Go to Previous Page
  • Go to page 1
  • Go to page 2
  • Go to page 3
  • Go to page 4
  • Go to page 5
  • Interim pages omitted …
  • Go to page 9
  • Go to Next Page »

Primary Sidebar

Email Notification

get new posts sent to you automatically (free)
Loading

Recent Posts

  • Some new CMIP6 MSU comparisons
  • How not to science
  • Unforced variations: March 2023
  • The established ground and new ideas
  • 2022 updates to model-observation comparisons
  • Unforced variations: Feb 2023

Our Books

Book covers
This list of books since 2005 (in reverse chronological order) that we have been involved in, accompanied by the publisher’s official description, and some comments of independent reviewers of the work.
All Books >>

Recent Comments

  • b fagan on Unforced variations: March 2023
  • Geoff Miell on Unforced variations: March 2023
  • Piotr on Unforced variations: March 2023
  • Piotr on Unforced variations: March 2023
  • Carbomontanus on Unforced variations: March 2023
  • Carbomontanus on Unforced variations: March 2023
  • nigelj on Unforced variations: March 2023
  • JCM on Unforced variations: March 2023
  • JCM on Unforced variations: March 2023
  • Victor on Unforced variations: March 2023
  • Carbomontanus on Unforced variations: March 2023
  • macias shurly on Some new CMIP6 MSU comparisons

Footer

ABOUT

  • About
  • Translations
  • Privacy Policy
  • Contact Page
  • Login

DATA

  • Data Sources
  • Climate model projections compared to observations

INDEX

  • Acronym index
  • Index

Realclimate Stats

1,296 posts

8 pages

230,051 comments

Copyright © 2023 · RealClimate is a commentary site on climate science by working climate scientists for the interested public and journalists.