This month’s open thread on climate topics.
Blog – realclimate.org – All Posts
The 5th International Conference on Regional Climate
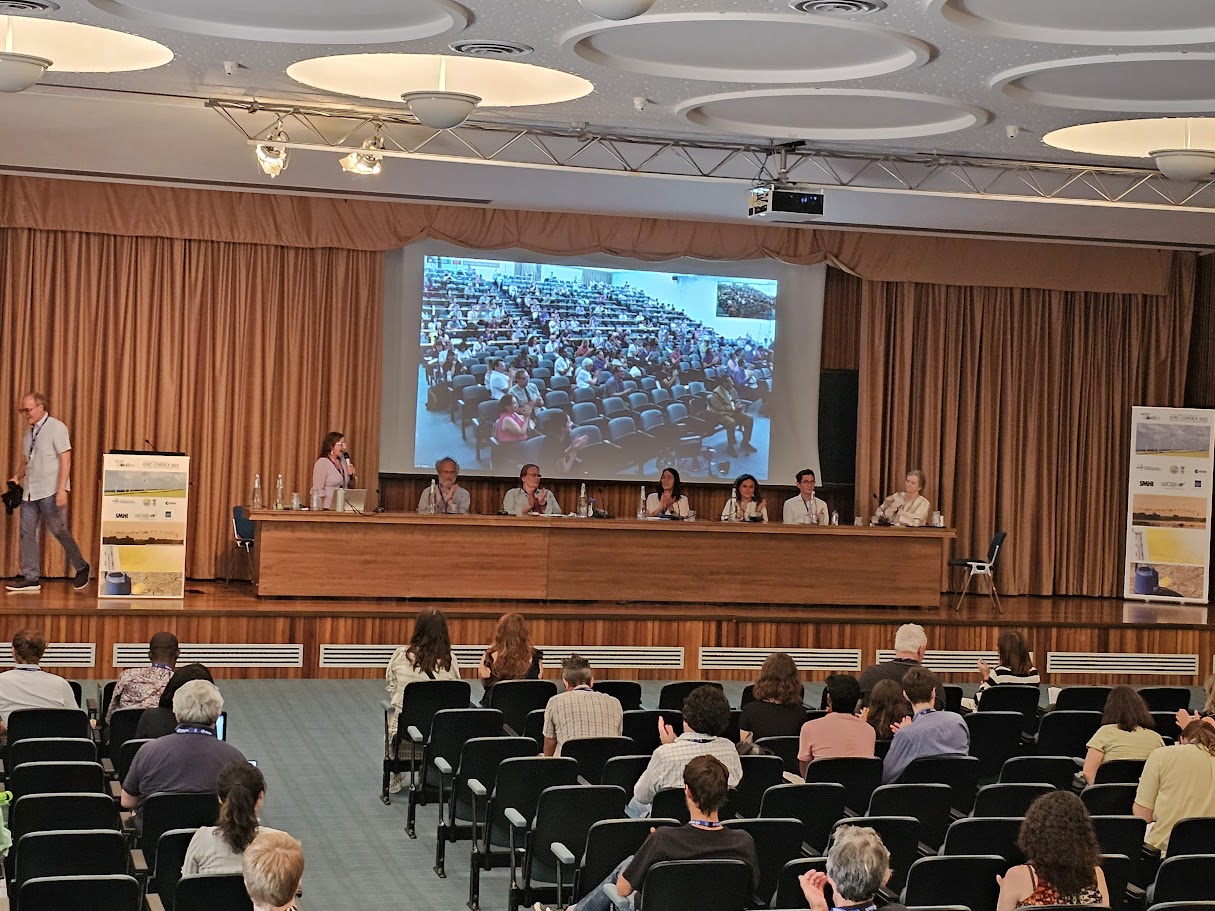
The fifth international conference on regional climate (ICRC 2023), organised by World Climate Research Programme’s (WCRP) coordinated downscaling experiment (CORDEX), has just completed. It was a hybrid on-site/online conference with hubs in both Trieste/Italy (hosted by the International Centre on Theoretical Physics, ICTP) and Pune/India.
The hybrid set-up, with video links between the two hubs and digital attendence through zoom, was a change from previous ICRCs held in ICTP (2011), Brussels (2013), Stockholm (2016), and Beijing (2019). It worked impressively well, and the CORDEX ICRC 2023 streaming is available from the WCRP CORDEX YouTube channel.
It seems as an eternity since the previous ICRC before the COVID pandemic, so I was curious to see how things have progressed since then. It was also interesting to compare my impressions from this conference with my blog posts here on RealClimate from the first ICRC in Trieste, the second in Brussels, the third ICRC in Stockholm, I see that questions concerning uncertainty and added value are still being debated.
Unforced variations: Oct 2023
This month’s open thread on climate topics. Please try to stay on topic and refrain from posting tedious, oft-debunked nonsense. Look out for more reports of ridiculously high global temperatures and intense rainfall, and more confident predictions of the budding El Niño event and annual temperature rankings…
Old habits
Media awareness about global warming and climate change has grown fairly steadily since 2004. My impression is that journalists today tend to possess a higher climate literacy than before. This increasing awareness and improved knowledge is encouraging, but there are also some common interpretations which could be more nuanced. Here are two examples, polar amplification and extreme rainfall.
[Read more…] about Old habitsThe Scafetta Saga
It has taken 17 months to get a comment published pointing out the obvious errors in the Scafetta (2022) paper in GRL.
Back in March 2022, Nicola Scafetta published a short paper in Geophysical Research Letters (GRL) purporting to show through ‘advanced’ means that ‘all models with ECS > 3.0°C overestimate the observed global surface warming’ (as defined by ERA5). We (me, Gareth Jones and John Kennedy) wrote a note up within a couple of days pointing out how wrongheaded the reasoning was and how the results did not stand up to scrutiny.
[Read more…] about The Scafetta SagaReferences
- N. Scafetta, "Advanced Testing of Low, Medium, and High ECS CMIP6 GCM Simulations Versus ERA5‐T2m", Geophysical Research Letters, vol. 49, 2022. http://dx.doi.org/10.1029/2022GL097716
As Soon as Possible
The latest contrarian crowd pleaser from Soon et al (2023) is just the latest repetition of the old “it was the sun wot done it” trope[1] that Willie Soon and his colleagues have been pushing for decades. There is literally nothing new under the sun.
[Read more…] about As Soon as PossibleReferences
- W. Soon, R. Connolly, M. Connolly, S. Akasofu, S. Baliunas, J. Berglund, A. Bianchini, W. Briggs, C. Butler, R. Cionco, M. Crok, A. Elias, V. Fedorov, F. Gervais, H. Harde, G. Henry, D. Hoyt, O. Humlum, D. Legates, A. Lupo, S. Maruyama, P. Moore, M. Ogurtsov, C. ÓhAiseadha, M. Oliveira, S. Park, S. Qiu, G. Quinn, N. Scafetta, J. Solheim, J. Steele, L. Szarka, H. Tanaka, M. Taylor, F. Vahrenholt, V. Velasco Herrera, and W. Zhang, "The Detection and Attribution of Northern Hemisphere Land Surface Warming (1850–2018) in Terms of Human and Natural Factors: Challenges of Inadequate Data", Climate, vol. 11, pp. 179, 2023. http://dx.doi.org/10.3390/cli11090179
Unforced variations: Sep 2023
This month’s open thread on climate science topics. It’s been a warm summer, dontcha know? Expect ERA5, the satellite data and then the surface data products to confirm this in the next week or so. Sea ice minimum in the Arctic will also occur soon, as will a record low maximum in the Antarctic. El Niño still building in the tropical Pacific. Interesting times…
The AMOC: tipping this century, or not?
A few weeks ago, a study by Copenhagen University researchers Peter and Susanne Ditlevsen concluded that the Atlantic Meridional Overturning Circulation (AMOC) is likely to pass a tipping point already this century, most probably around mid-century. Given the catastrophic consequences of an AMOC breakdown, the study made quite a few headlines but also met some skepticism. Now that the dust has settled, here some thoughts on the criticisms that have been raised about this study.
I’ve seen two main arguments there.
1. Do the data used really describe changes in AMOC?
We have direct AMOC measurements only since 2004, a time span too short for this type of study. So the Ditlevsens used sea surface temperatures (SST) in a region between the tip of Greenland and Britain as an indicator, based on Caesar et al. 2018 (PDF; I’m a coauthor on that paper). The basic idea starts with the observation that this region is far warmer than what is normal for that latitude, because the AMOC delivers a huge amount of heat into the area. The following chart which I made 25 years ago illustrates this.
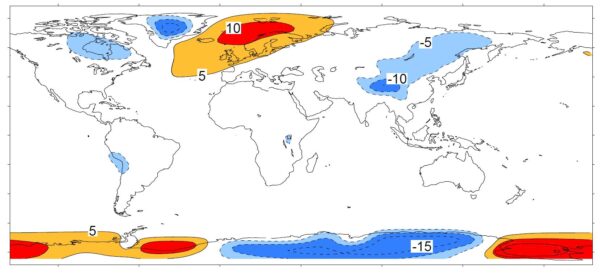
If the AMOC weakens, this region will cool. And in fact it is cooling – it’s the only region on Earth which has cooled since preindustrial times. This is commonly referred to as ‘warming hole’ or ‘cold blob’.
We argued in Caesar et al. that the sea surface temperature there in winter is a good index of AMOC strength, based on a high-resolution climate model. (Not in summer when the ocean is covered by a shallow surface mixed layer heated by the sun and highly dependent on weather conditions.) We checked this across other climate models and found that our AMOC index (i.e. based on SST in the ‘cold blob’ region) and the actual AMOC slowdown correlated highly there (correlation coefficient R=0.95).
There are some other indicators, either using measured ocean salinities or using various types of proxy data from sediment cores, e.g. sediment grain sizes at the ocean bottom as indicators of flow speed of the deep southward AMOC branch. The key point to me is: these different indicators provide rather consistent AMOC reconstructions, as we showed in Caesar et al. 2021. The sediment data go back further in time but are likely not as reliable and don’t reach up to the present.
For recent decades there are potentially better approaches like ocean state estimates, and those are also consistent with the SST fingerprint – but these don’t go back far enough in time for the Ditlevsen type of study. The next graph shows a comparison of different reconstructions for the relevant time period used in the Ditlevsen study.
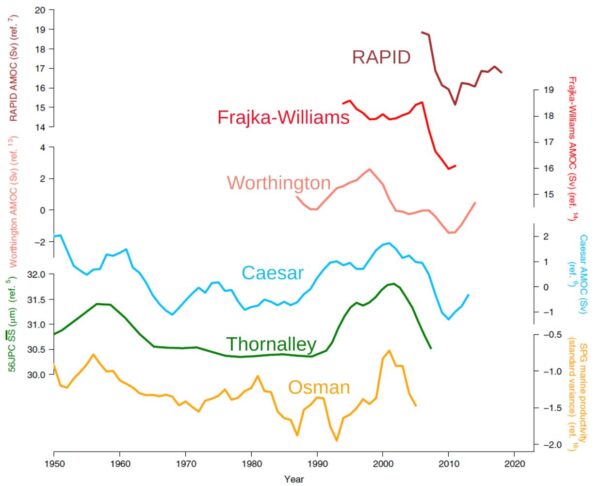
Reconstructions based on salinity may also be good but they depend on precipitation, a notoriously variable quantity so it is rather doubtful whether analysing variance of salinity is doing any better than the SST signal.
The argument has been made that the ‘cold blob’ might not be caused by an AMOC decline but by heat loss at the ocean surface. That’s easy to check: if that were the case, then cooling in the area would be linked to increased heat loss at the surface. But if the AMOC is the culprit, then less heat should be lost, as a cooler ocean surface due to reduced ocean heat transport will lose less heat. The reanalysis data show the latter is the case.
This was shown by Halldór Björnsson of the Icelandic weather service and presented at the Arctic Circle conference 2016. I discussed this here in 2016 and also in my 2018 RealClimate article “If you doubt that the AMOC has weakened, read this”, together with possible other alternative explanations of the ‘cold blob’. We have recently repeated Halldór’s analysis at PIK and got the same results.
My conclusion: for the past century or so the SST data are probably the best AMOC indicator we have, and I don’t see concrete evidence suggesting that it’s unreliable.
2. The Ditlevsen study assumes that the AMOC follows a quadratic curve when approaching the tipping point.
That’s a more technical criticism. Their assumption follows from Stommel’s 1961 simple model of the AMOC tipping point. It results from the basic idea that (a) AMOC changes are proportional to density changes, and (b) the density change results from a balance between freshwater input and AMOC salt transport to the deep water formation (i.e. ‘cold blob’) region. Combined, these two assumptions lead to a quadratic equation.
These are very plausible basic assumptions, albeit using a linear equation of state, but we all know you can linearize things around a given point to get a first-order estimate. The argument that this is “too simple” doesn’t mean it’s wrong; rather this is correct at least to first order.
In a 1996 study I compared the results of a quadratic box model response to a fully-fledged 3D primitive equation ocean circulation model with nonlinear equation of state, the MOM model of the Geophysical Fluid Dynamics Lab in Princeton. It looks like this.
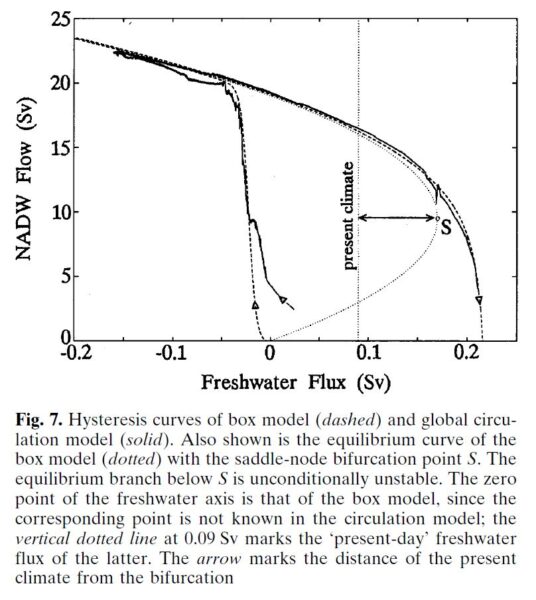
You can’t get a much better fit than that. A similar quadratic shape has also been found by Henk Dijkstra’s group at Utrecht University in a state-of-the-art global climate model, the CESM model (yet to be published). I have not seen any concrete evidence by the critics suggesting the shape may not be quadratic; that seems to be a purely hypothetical possibility. Also, if it is not exactly quadratic, the stated uncertainty range will be larger but it doesn’t fundamentally change the result.
What does it all mean?
An AMOC collapse would be a massive, planetary-scale disaster. Some of the consequences: Cooling and increased storminess in northwestern Europe, major additional sea level rise especially along the American Atlantic coast, a southward shift of tropical rainfall belts (causing drought in some regions and flooding in others), reduced ocean carbon dioxide uptake, greatly reduced oxygen supply to the deep ocean, likely ecosystem collapse in the northern Atlantic, and others. Check out the OECD report Climate Tipping Points which is well worth reading, and the maps below. You really want to prevent this from happening.
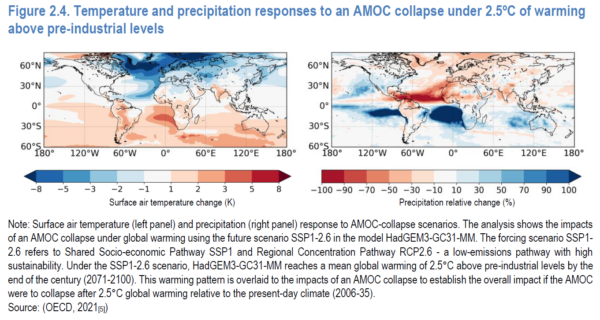
We know from paleoclimatic data that there have been a number of drastic, rapid climate changes with focal point in the North Atlantic due to abrupt AMOC changes, apparently after the AMOC passed a tipping point. They are known as Heinrich events and Dansgaard-Oeschger events, see my review in Nature (pdf).
The point: it is a risk we should keep to an absolute minimum.
In other words: we are talking about risk analysis and disaster prevention. This is not about being 100% sure that the AMOC will pass its tipping point this century; it is that we’d like to be 100% sure that it won’t. Even if there were just (say) a 40% chance that the Ditlevsen study is correct in the tipping point being reached between 2025 and 2095, that’s a major change to the previous IPCC assessment that the risk is less than 10%. Even a <10% chance as of IPCC (for which there is only “medium confidence” that it’s so small) is in my view a massive concern. That concern has increased greatly with the Ditlevsen study – that is the point, and not whether it’s 100% correct and certain.
Would you live in a village below a dammed lake if you’re told there is a one in ten chance that one day the dam will break and much of the village will be washed away? Would you say: “Not to worry, that’s 90 % chance it won’t happen?” Or would you demand action by the authorities to reduce the risk? What if a new study appears, experienced scientists, reputable journal, that says it is nearly certain that the dam will break, the question is only when? Would you demand immediate attention to mitigate this danger, or would you say: “Oh well, some have questioned whether the assumptions of this study are entirely correct. Let’s just assume it is wrong”?
For the AMOC (and other climate tipping points), the only action we can take to minimise the risk is to get out of fossil fuels and stop deforestation as fast as possible. One major assumption of the Ditlevsen study is that global warming continues as in past decades. That is in our hands – or more precisely, that of our governments and powerful corporations. In 2022, the G20 governments alone subsidised fossil fuel use with 1.4 trillion dollars, up by 475% above the previous year. They aren’t trying to end fossil fuels.
Yet, as soon as we reach zero emissions, global warming will stop within years, and the sooner this happens the smaller the risk of passing tipping points. It also minimises lots of other losses, damages and human suffering from “regular” global warming impacts, which are already happening all around us even without passing major climate tipping points.
Links
For more on this, see my long TwiX thread with many images from relevant studies.
What is happening in the Atlantic Ocean to the AMOC?
If you doubt that the AMOC has weakened, read this
AMOC slowdown: Connecting the dots
And for even more, just enter “AMOC” into the search field of this blog!
Unforced Variations: Aug 2023
What is happening in the Atlantic Ocean to the AMOC?
For various reasons I’m motivated to provide an update on my current thinking regarding the slowdown and tipping point of the Atlantic Meridional Overturning Circulation (AMOC). I attended a two-day AMOC session at the IUGG Conference the week before last, there’s been interesting new papers, and in the light of that I have been changing my views somewhat. Here’s ten points, starting from the very basics, so you can easily jump to the aspects that interest you.
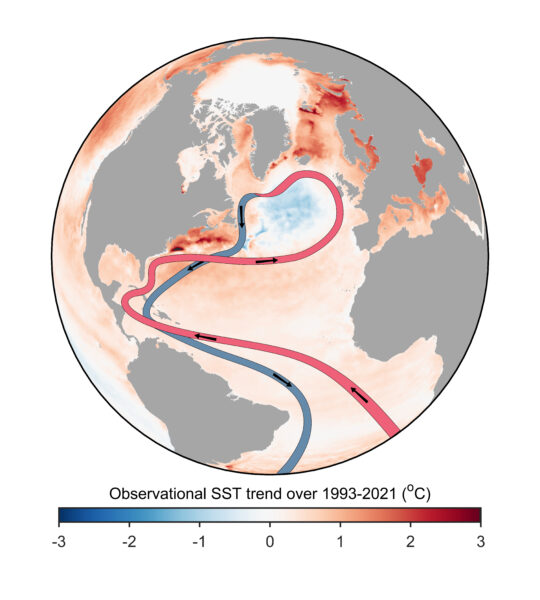
1. The AMOC is a big deal for climate. The Atlantic meridional overturning circulation (AMOC) is a large-scale overturning motion of the entire Atlantic, from the Southern Ocean to the high north. It moves around 15 million cubic meters of water per second (i.e. 15 Sverdrup). The AMOC water passes through the Gulf Stream along a part of its much longer journey, but contributes only the smaller part of its total flow of around 90 Sverdrup. The AMOC is driven by density differences and is a deep reaching vertical overturning of the Atlantic; the Gulf Stream is a near-surface current near the US Atlantic coast and mostly driven by winds. The AMOC however moves the bulk of the heat into the northern Atlantic so is highly relevant for climate, because the southward return flow is very cold and deep (heat transport is the flow multiplied by the temperature difference between northward and southward flow). The wind-driven part of the Gulf Stream contributes much less to the net northward heat transport, because that water returns to the south at the surface in the eastern Atlantic at a temperature not much colder than the northward flow, so it leaves little heat behind in the north. So for climate impact, the AMOC is the big deal, not the Gulf Stream.
2. The AMOC has repeatedly shown major instabilities in recent Earth history, for example during the Last Ice Age, prompting concerns about its stability under future global warming, see e.g. Broecker 1987 who warned about “unpleasant surprises in the greenhouse”. Major abrupt past climate changes are linked to AMOC instabilities, including Dansgaard-Oeschger-Events and Heinrich Events. For more on this see my Review Paper in Nature.
3. The AMOC has weakened over the past hundred years. We don’t have direct measurements over such a long time (only since 2004 from the RAPID project), but various indirect indications. We have used the time evolution of the ‘cold blob’ shown above, using SST observations since 1870, to reconstruct the AMOC in Caesar et al. 2018. In that article we also discuss a ‘fingerprint’ of an AMOC slowdown which also includes excessive warming along the North American coast, also seen in Figure 1. That this fingerprint is correlated with the AMOC in historic runs with CMIP6 models has recently been shown by Latif et al. 2022, see Figure 2.
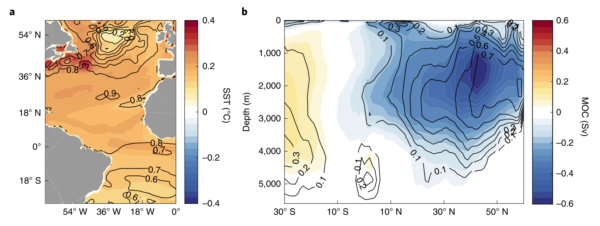
Others have used changes in the Florida Current since 1909, or changes in South Atlantic salinity, to reconstruct past AMOC changes – for details check out my last AMOC article here at RealClimate.
4. The AMOC is now weaker than any time in the past millennium. Several groups of paleoclimatologists have used a variety of methods to reconstruct the AMOC over longer time spans. We compiled the AMOC reconstructions we could find in Caesar et al. 2021, see Figure 3. In case you’re wondering how the proxy data reconstructions compare with other methods for the recent variability since 1950, that is shown in Caesar et al. 2022 (my take: quite well).
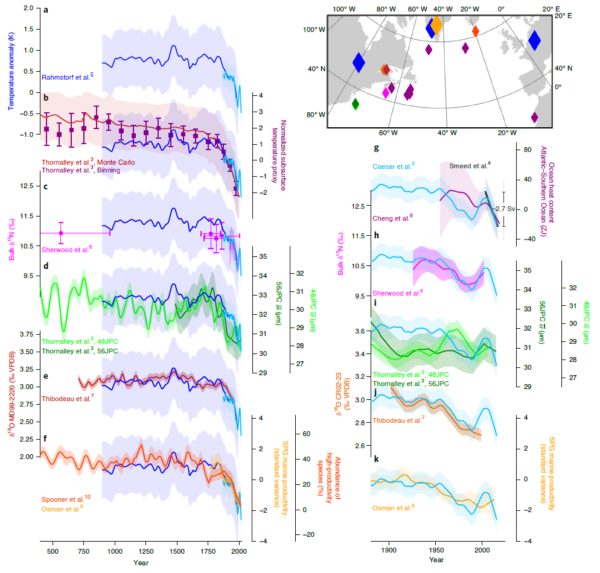
5. The long-term weakening trend is anthropogenic. For one, it is basically what climate models predict as a response to global warming, though I’d argue they underestimate it (see point 8 below). A recent study by Qasmi 2023 has combined observations and models to isolate the role of different drivers and concludes for the ‘cold blob’ region: “Consistent with the observations, an anthropogenic cooling is diagnosed by the method over the last decades (1951–2021) compared to the preindustrial period.”
In addition there appear to be decadal oscillations particularly after the mid-20th Century. They may be natural variability, or an oscillatory response to modern warming, given there is a delayed negative feedback in the system (weak AMOC makes the ‘cold blob’ region cool down, that increases the water density there, which strengthens the AMOC). Increasing oscillation amplitude may also be an early warning sign of the AMOC losing stability, see point 10 below.
The very short term SST variability (seasonal, interannual) in the cold blob region is likely just dominated by the weather, i.e. surface heating and cooling, and not indicative of changes in ocean currents.
6. The AMOC has a tipping point, but it is highly uncertain where it is. This tipping point was first described by Stommel 1961 in a highly simple model which captures a fundamental feedback. The region in the northern Atlantic where the AMOC waters sink down is rather salty, because the AMOC brings salty water from the subtropics to this region. If it becomes less salty by an inflow of freshwater (rain or meltwater from melting ice), the water becomes less dense (less “heavy”), sinks down less, the AMOC slows down. Thus it brings less salt to the region, which slows the AMOC further. It is called the salt advection feedback. Beyond a critical threshold this becomes a self-amplifying “vicious circle” and the AMOC grinds to a halt. That threshold is the AMOC tipping point. Stommel wrote: “The system is inherently frought with possibilities for speculation about climatic change.”
That this tipping point exists has been confirmed in numerous models since Stommel’s 1961 paper, including sophisticated 3-dimensional ocean circulation models as well as fully fledged coupled climate models. We published an early model comparison about this in 2005. The big uncertainty, however, is in how far the present climate is from this tipping point. Models greatly differ in this regard, the location appears to be sensitively dependent on the finer details of the density distribution of the Atlantic waters. I have compared the situation to sailing with a ship into uncharted waters, where you know there are dangerous rocks hidden below the surface that could seriously damage your ship, but you don’t know where they are.
7. Standard climate models have suggested the risk is relatively small during this century. Take the IPCC reports: For example, the Special Report on the Ocean and Cryosphere concluded:
The AMOC is projected to weaken in the 21st century under all RCPs (very likely), although a collapse is very unlikely (medium confidence). Based on CMIP5 projections, by 2300, an AMOC collapse is about
as likely as not for high emissions scenarios and very unlikely for lower ones (medium confidence).
It has long been my opinion that “very unlikely”, meaning less than 10% in the calibrated IPCC uncertainty jargon, is not at all reassuring for a risk we really should rule out with 99.9 % probability, given the devastating consequences should a collapse occur.
8. But: Standard climate models probably underestimate the risk. There are two reasons for that. They largely ignore Greenland ice loss and the resulting freshwater input to the northern Atlantic which contributes to weakening the AMOC. And their AMOC is likely too stable. There is a diagnostic for AMOC stability, namely the overturning freshwater transport, which I introduced in a paper in 1996 based on Stommel’s 1961 model. Basically, if the AMOC exports freshwater out of the Atlantic, then an AMOC weakening would lead to a fresher (less salty) Atlantic, which would weaken the AMOC further. Data suggest that the real AMOC exports freshwater, in most models it imports freshwater. This is still the case and was also discussed at the IUGG conference.
Here a quote from Liu et al. 2014, which nicely sums up the problem and gives some references:
Using oceanic freshwater transport associated with the overturning circulation as an indicator of the AMOC bistability (Rahmstorf 1996), analyses of present-day observations also indicate a bistable AMOC (Weijer et al. 1999; Huisman et al. 2010; Hawkins et al. 2011a,b; Bryden et al. 2011; Garzoli et al. 2012). These observational studies suggest a potentially bistable AMOC in the real world. In contrast, sensitivity experiments in CGCMs tend to show a monostable AMOC (Stouffer et al. 2006), indicating a model bias toward a monostable AMOC. This monostable bias of the AMOC in CGCMs, as first pointed out by Weber et al. (2007) and later confirmed by Drijfhout et al. (2011), could be related to a bias in the northward freshwater transport in the South Atlantic by the meridional overturning circulation.
9. Standard climate models get the observed ‘cold blob’, but only later. Here is some graphs from the current IPCC report, AR6.

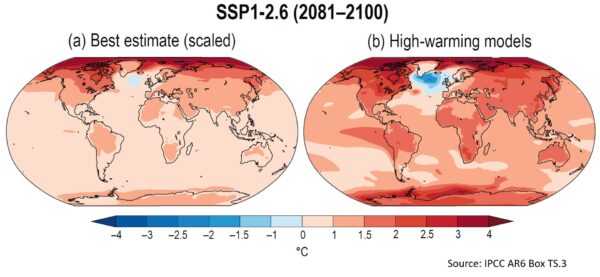
10. There are possible Early Warning Signals (EWS). New methods from nonlinear dynamics search for those warning signals when approaching tipping points in observational data, from cosmology to quantum systems. They use the critical slowing down, increasing variance or increasing autocorrelation in the variability of the system. There is the paper by my PIK colleague Niklas Boers (2021), which used 8 different data series (Figure 6) and concluded there is “strong evidence that the AMOC is indeed approaching a critical, bifurcation-induced transition.”

Another study, this time using 312 paleoclimatic proxy data series going back a millennium, is Michel et al. 2022. They argue to have found a “robust estimate, as it is based on sufficiently long observations, that the Atlantic Multidecadal Variability may now be approaching a tipping point after which the Atlantic current system might undergo a critical transition.”
And today (update!) a third comparable study by Danish colleagues has been published, Ditlevsen & Ditlevsen 2023, which expects the tipping point already around 2050, with a 95% uncertainty range for the years 2025-2095. Individual studies always have weaknesses and limitations, but when several studies with different data and methods point to a tipping point that is already quite close, I think this risk should be taken very seriously.
Conclusion
Timing of the critical AMOC transition is still highly uncertain, but increasingly the evidence points to the risk being far greater than 10 % during this century – even rather worrying for the next few decades. The conservative IPCC estimate, based on climate models which are too stable and don’t get the full freshwater forcing, is in my view outdated now. I side with the recent Climate Tipping Points report by the OECD, which advised:
Yet, the current scientific evidence unequivocally supports unprecedented, urgent and ambitious climate action to tackle the risks of climate system tipping points.
If you like to know more about this topic, you can either watch my short talk from the Exeter Tipping Points conference last autumn (where also Peter Ditlevsen first presented the study which was just published), or the longer video of my EPA Climate Lecture in Dublin Mansion House last April.