As many of you will know, Geert Jan van Oldenborgh died on Oct 12, 2021, and in the last week a number of very touching tributes have appeared. Notably, a lovely obituary in the NY Times by Henry Fountain, a segment on the BBC’s Inside Science from Roland Pease, a piece on Bloomberg News by Eric Roston and, of course, an appreciation from his colleagues at World Weather Attribution (including Friederike Otto, the co-recipient of the TIME 100 award to Geert earlier this year).
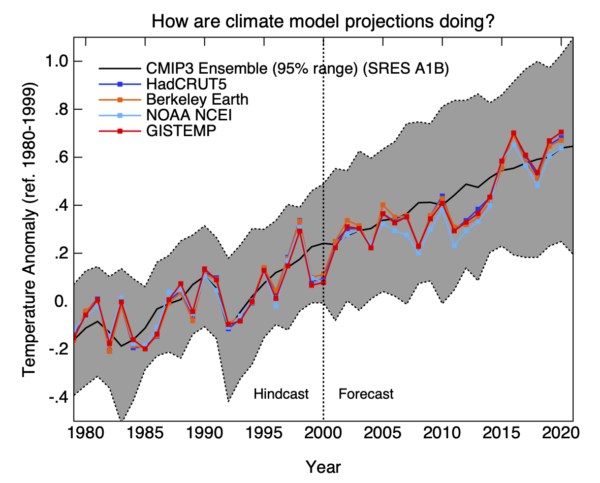
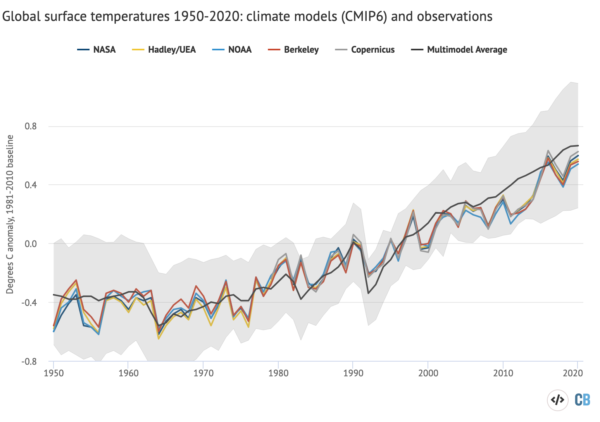
Geert’s work had been featured often at RealClimate (notably the rapid attribution work for the Pacific North West heat wave earlier this year), and we have made frequent reference to Climate Explorer, the tool he built to provide easier access to many sources of climate data. He also provided us with annual updates for the comparison between a 1981 climate projection to subsequent observations.
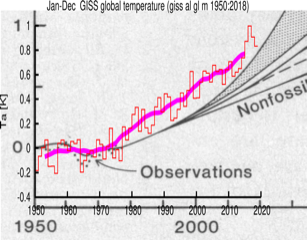
He let us know earlier this year that this was likely the last update. Moge hij rusten in vrede.