• Skip to primary navigation
  • Skip to main content
  • Skip to primary sidebar
  • Skip to footer

RealClimate

Climate science from climate scientists...

  • Start here
  • Model-Observation Comparisons
  • Miscellaneous Climate Graphics
  • Surface temperature graphics
You are here: Home / Archives for Gavin

about Gavin Schmidt

Gavin Schmidt is a climate modeler, working for NASA and with Columbia University.

The IPCC AR5 attribution statement

10 Oct 2013 by Gavin

Last year I discussed the basis of the AR4 attribution statement:

Most of the observed increase in global average temperatures since the mid-20th century is very likely due to the observed increase in anthropogenic greenhouse gas concentrations.

In the new AR5 SPM (pdf), there is an analogous statement:

It is extremely likely that more than half of the observed increase in global average surface temperature from 1951 to 2010 was caused by the anthropogenic increase in greenhouse gas concentrations and other anthropogenic forcings together. The best estimate of the human-induced contribution to warming is similar to the observed warming over this period.

This includes differences in the likelihood statement, drivers and a new statement on the most likely amount of anthropogenic warming.

[Read more…] about The IPCC AR5 attribution statement

Filed Under: Climate modelling, Climate Science, Instrumental Record, IPCC

The evolution of radiative forcing bar-charts

7 Oct 2013 by Gavin

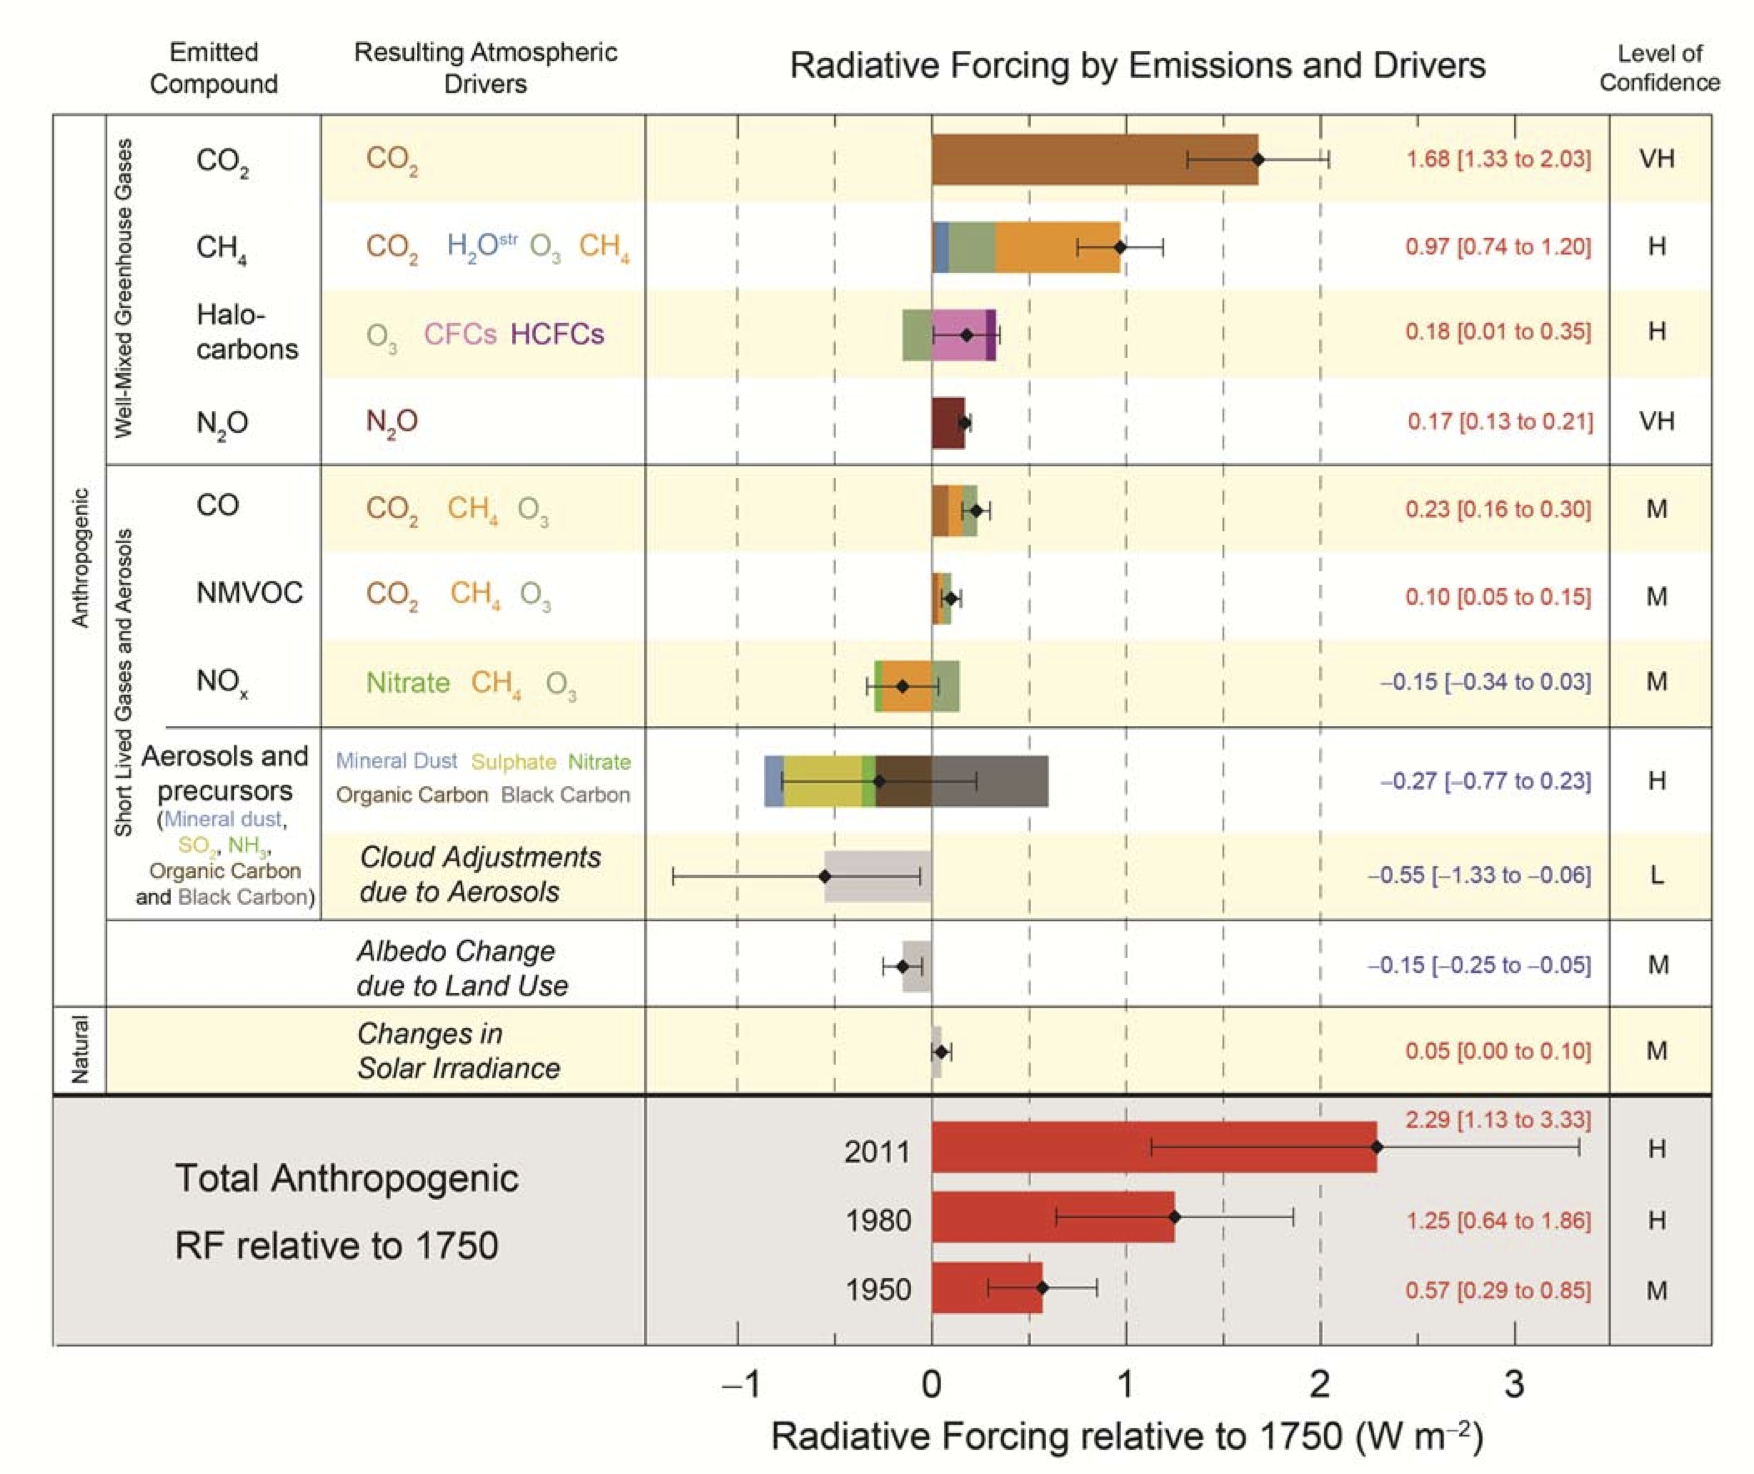
As part of the IPCC WG1 SPM (pdf) released last Friday, there was a subtle, but important, change in one of the key figures – the radiative forcing bar-chart (Fig. SPM.4). The concept for this figure has been a mainstay of summaries of climate change science for decades, and the evolution over time is a good example of how thinking and understanding has progressed over the years while the big picture has not shifted much.


The Radiative-Forcing bar chart: AR5 version
[Read more…] about The evolution of radiative forcing bar-charts

Filed Under: Climate Science, Greenhouse gases, IPCC

On mismatches between models and observations

13 Sep 2013 by Gavin

It is a truism that all models are wrong. Just as no map can capture the real landscape and no portrait the true self, numerical models by necessity have to contain approximations to the complexity of the real world and so can never be perfect replications of reality. Similarly, any specific observations are only partial reflections of what is actually happening and have multiple sources of error. It is therefore to be expected that there will be discrepancies between models and observations. However, why these arise and what one should conclude from them are interesting and more subtle than most people realise. Indeed, such discrepancies are the classic way we learn something new – and it often isn’t what people first thought of.
[Read more…] about On mismatches between models and observations

Filed Under: Climate modelling, Climate Science, Instrumental Record

Arctic misrepresentations

8 Jul 2013 by Gavin

At the weekend, Christopher Booker at the Daily Telegraph made another attempt (see previous) to downplay the obvious decreases in Arctic sea ice by (mis-)quoting a statement from Arctic oceanographer Ken Drinkwater and colleagues:
[Read more…] about Arctic misrepresentations

Filed Under: Arctic and Antarctic, Climate Science

AGU Chapman Conference on Climate Science Communication

8 Jul 2013 by Gavin

A couple of weeks ago, there was a small conference on Climate Science communication run by the AGU. Both Mike and I attended, but it was very notable that it wasn’t just scientists attending – there were also entertainers, psychologists, film-makers and historians. There were a lot of quite diverse perspectives and many discussions about the what’s, why’s and how’s of climate science communication.

There were a couple of notable features: the conference had a lively twitter hashtag (#climatechapman), and almost the entire proceedings were webcast live (schedule). The video from this has now been posted on YouTube in more bite-sized chunks.

While our own presentations (Mike here and Gavin here) are available, it is worth watching the presentations from people you might not have heard of, as well as a few from more established people. We’ll embed a few here, but please point out some of the other ones of interest in the comments.
[Read more…] about AGU Chapman Conference on Climate Science Communication

Filed Under: Climate Science, Communicating Climate

2012 Updates to model-observation comparisons

7 Feb 2013 by Gavin

Time for the 2012 updates!

As has become a habit (2009, 2010, 2011), here is a brief overview and update of some of the most discussed model/observation comparisons, updated to include 2012. I include comparisons of surface temperatures, sea ice and ocean heat content to the CMIP3 and Hansen et al (1988) simulations.
[Read more…] about 2012 Updates to model-observation comparisons

Filed Under: Aerosols, Arctic and Antarctic, Climate modelling, Climate Science, El Nino, Greenhouse gases, Instrumental Record, Model-Obs Comparisons

What to study?

15 Jan 2013 by Gavin

I recently got an email from newly graduated Math(s) major (mildly edited):

I am someone with a deep-seated desire to help the planet remain as habitable as possible in the face of the trials humanity is putting it through. I’d like to devote my career to this cause, but am young and haven’t chosen a definitive career path yet. My bachelors is in pure math and I am considering graduate study in either applied math or statistics. I’m curious what you would recommend to someone in my position. Between getting, say, a PhD in statistics vs. one in applied math, what positions me best for a career in the climate science community? What are its acute needs, where are the job opportunities, and how competitive is it?

My response was as follows (also slightly edited):

As you may know I too started out as a mathematician, and then moved to more climate related applications only in my post-doc(s).

I can’t possibly give you ‘the’ answer to your question – but I do suggest working from the top down. What do you see specifically as something where someone like you could have maximum impact? Then acquire the skills needed to make that happen. If that seems too hard to do now, spend time on the developing your basic toolkits – Bayesian approaches to statistics, forward modeling, some high level coding languages (R, python, matlab etc.), while reading widely about applications.

One of the things I appreciated most in finding my niche was being exposed to a very large number of topics – which while bewildering at the start, in the end allowed me to see the gaps where I could be most useful. At all times though, I pursued approaches and topics that were somewhat aesthetically pleasing to me, which is to say, I didn’t just take up problems just for the sake of it.

I’ve found that I get more satisifaction from focusing on making some progress related to big problems, rather than finding complete solutions to minor issues, but this probably differs from person to person.

But what do other people think? How should people prepare to work on important problems? Are there any general rules? What advice did people give you when you were starting out? Was it useful, or not? Any advice – from existing researchers, graduate students or interested public – will be welcome.

Filed Under: Climate Science

On sensitivity: Part I

3 Jan 2013 by Gavin

Climate sensitivity is a perennial topic here, so the multiple new papers and discussions around the issue, each with different perspectives, are worth discussing. Since this can be a complicated topic, I’ll focus in this post on the credible work being published. There’ll be a second part from Karen Shell, and in a follow-on post I’ll comment on some of the recent games being played in and around the Wall Street Journal op-ed pages.

[Read more…] about On sensitivity: Part I

Filed Under: Aerosols, Climate modelling, Climate Science, IPCC, Paleoclimate

Improving the Tropical Cyclone Climate Record

16 Dec 2012 by Gavin

Guest Commentary by Christopher Hennon (UNC Asheville)

Get involved in a new citizen science project at CycloneCenter.org.

The poor quality of the tropical cyclone (TC) data record provides severe constraints on the ability of climate scientists to: a) determine to what degree TCs have responded to shifts in climate, b) evaluate theories on how TCs will respond to climate change in the future. The root cause for the poor data is the severity of the TC conditions (e.g. high wind, rough seas) and the remoteness of these storms – the vast majority of which form and remain well away from most observing networks. Thus, most TCs are not observed directly and those that are (with buoys, aircraft reconnaissance, ships) are often not sampled sufficiently (see the IBTrACS, (Knapp et al., 2010)).

This leaves tropical cyclone forecasters, who are ultimately responsible for recording TC tracks and intensities (i.e. maximum wind speeds), with a challenging problem. Fortunately, there is a tool called the Dvorak Technique which allows forecasters to make a reasonable determination of the TC intensity by simply analyzing a single infrared or visible satellite image, which is almost always available Velden et al., 2006). The technique calls for the analyst to determine the center location of the system, the cloud pattern type, the degree of organization of the pattern, and the intensity trend. A maximum surface wind speed is determined after the application of a number of rules and constraints.

Hurricane Gay (1992)The Dvorak Technique has been used for many years at all global tropical cyclone forecast centers and has been shown in many cases to yield a good estimate of maximum TC wind speed, when applied properly (Knaff et al., 2010). However, there is a level of analyst subjectivity inherent in the procedure; the cloud patterns are not always clear, it is sometimes difficult to accurately determine the storm center and the rules and constraints have been interpreted and applied differently across agencies. This introduces heterogeneity in the global TC record since the Dvorak Technique is usually the only available tool for assessing the maximum wind speed.

There has been recent work to eliminate the human element in the Dvorak Technique by automating the procedure. The Advanced Dvorak Technique (ADT) uses objective storm center and cloud pattern schemes to remove the subjectivity (Olander and Velden, 2007). All other classification rules and constraints are then applied and combined with additional statistical information to produce automated intensity estimates. Although the ADT skill is comparable to experienced human Dvorak analysts, large errors can occur if the scene type is not identified properly.

A new crowd sourcing project, called Cyclone Center, embraces the human element by enabling the public to perform a simplified version of the Dvorak Technique to analyze historical global tropical cyclone (TC) intensities (Hennon, 2012). Cyclone Center’s primary goal is to resolve discrepancies in the recent global TC record arising principally from inconsistent development of tropical cyclone intensity data. The Cyclone Center technique standardizes the classification procedure by condensing the Dvorak Technique to a few simple questions that can be answered by global, nonprofessional users.

One of the main advantages of this approach is the inclusion of thousands of users, instead of the 1-3 who would normally classify a TC image. This allows the computation of measures of uncertainty in addition to a mean intensity. Nearly 300,000 images, encompassing all global TCs that formed from 1978-2009, will be classified 30 times each – a feat that would take a dedicated team of twenty Dvorak-trained experts about 12 years to complete. Citizen scientists have already performed over 100,000 classifications since the project launch in September. Once the project is complete, a new dataset of global TC tracks and intensities will be made available to the community to contribute to our efforts to provide the best possible TC data record.

Interested readers are encouraged to learn more about and participate in the project at the cyclonecenter.org website (there are some FAQ on the project blog). The CycloneCenter project is a collaboration between the Citizen Science Alliance, NOAA National Climatic Data Center (NCDC), University of North Carolina at Asheville, and the Cooperative Institute for Climate and Satellites (CICS) – North Carolina.

References

  1. K.R. Knapp, M.C. Kruk, D.H. Levinson, H.J. Diamond, and C.J. Neumann, "The International Best Track Archive for Climate Stewardship (IBTrACS)", Bulletin of the American Meteorological Society, vol. 91, pp. 363-376, 2010. http://dx.doi.org/10.1175/2009BAMS2755.1
  2. C. Velden, B. Harper, F. Wells, J.L. Beven, R. Zehr, T. Olander, M. Mayfield, C.â. Guard, M. Lander, R. Edson, L. Avila, A. Burton, M. Turk, A. Kikuchi, A. Christian, P. Caroff, and P. McCrone, "The Dvorak Tropical Cyclone Intensity Estimation Technique: A Satellite-Based Method that Has Endured for over 30 Years", Bulletin of the American Meteorological Society, vol. 87, pp. 1195-1210, 2006. http://dx.doi.org/10.1175/BAMS-87-9-1195
  3. J.A. Knaff, D.P. Brown, J. Courtney, G.M. Gallina, and J.L. Beven, "An Evaluation of Dvorak Technique–Based Tropical Cyclone Intensity Estimates", Weather and Forecasting, vol. 25, pp. 1362-1379, 2010. http://dx.doi.org/10.1175/2010WAF2222375.1
  4. T.L. Olander, and C.S. Velden, "The Advanced Dvorak Technique: Continued Development of an Objective Scheme to Estimate Tropical Cyclone Intensity Using Geostationary Infrared Satellite Imagery", Weather and Forecasting, vol. 22, pp. 287-298, 2007. http://dx.doi.org/10.1175/WAF975.1
  5. C.C. Hennon, "Citizen scientists analyzing tropical cyclone intensities", Eos, Transactions American Geophysical Union, vol. 93, pp. 385-387, 2012. http://dx.doi.org/10.1029/2012EO400002

Filed Under: Climate Science, Hurricanes, Instrumental Record

IPCC draft (redux)

14 Dec 2012 by Gavin

Amid the manufactured spin and excitement of the unofficial release of the IPCC WG1 Second Order Draft, it is worth remembering that this happened last time too:

IPCC draft: No comment

May 4, 2006

As everyone has now realised, the second-order draft of the new IPCC report has become very widely available and many of the contributors to this site, commenters and readers will have seen copies. Part of the strength of the IPCC process are the multiple stages of review – the report is already significantly improved (in clarity and scientific basis) from the first round of reviews, and one can anticipate further improvements from the ongoing round as well. Thus no statements from this draft report can be considered ‘official’. While most of the contents of the report will come as no surprise to frequent visitors here, we have decided that we are not going to discuss the report until it is finalised and released (sometime in February 2007). At that time, we’ll go chapter by chapter hopefully pulling out the interesting bits, but until then, we feel it’s more appropriate to respect the ‘Do not cite or quote’ injunctions that can be found on every page. We trust that our commenters will likewise respect the process. Patience, people, patience!

The only change is that AR5 will be released in September 2013.

Filed Under: Climate Science, IPCC

  • « Go to Previous Page
  • Page 1
  • Interim pages omitted …
  • Page 14
  • Page 15
  • Page 16
  • Page 17
  • Page 18
  • Interim pages omitted …
  • Page 40
  • Go to Next Page »

Primary Sidebar

Search

Search for:

Email Notification

<div class="emaillist" id="es_form_f1-n1"

Recent Posts

  • High-resolution ‘fingerprint’ images reveal a weakening Atlantic Ocean circulation (AMOC)
  • Unforced variations: Oct 2025
  • “But you said the ice was going to disappear in 10 years!”
  • Time and Tide Gauges wait for no Voortman
  • Lil’ NAS Express
  • DOE CWG Report “Moot”?

Our Books

Book covers
This list of books since 2005 (in reverse chronological order) that we have been involved in, accompanied by the publisher’s official description, and some comments of independent reviewers of the work.
All Books >>

Recent Comments

  • Mo Yunus on High-resolution ‘fingerprint’ images reveal a weakening Atlantic Ocean circulation (AMOC)
  • Keith Woollard on High-resolution ‘fingerprint’ images reveal a weakening Atlantic Ocean circulation (AMOC)
  • Killian on Unforced variations: Oct 2025
  • Scott Nudds on Unforced variations: Oct 2025
  • Mo Yunus on High-resolution ‘fingerprint’ images reveal a weakening Atlantic Ocean circulation (AMOC)
  • Ray Ladbury on High-resolution ‘fingerprint’ images reveal a weakening Atlantic Ocean circulation (AMOC)
  • Ray Ladbury on Unforced variations: Oct 2025
  • patrick o twentyseven on “But you said the ice was going to disappear in 10 years!”
  • Piotr on High-resolution ‘fingerprint’ images reveal a weakening Atlantic Ocean circulation (AMOC)
  • Mal Adapted on “But you said the ice was going to disappear in 10 years!”
  • Matthew R Marler on “But you said the ice was going to disappear in 10 years!”
  • Matthew R Marler on “But you said the ice was going to disappear in 10 years!”
  • Paul Pukite (@whut) on High-resolution ‘fingerprint’ images reveal a weakening Atlantic Ocean circulation (AMOC)
  • Ken Towe on High-resolution ‘fingerprint’ images reveal a weakening Atlantic Ocean circulation (AMOC)
  • Barton Paul Levenson on Unforced variations: Oct 2025
  • Barton Paul Levenson on High-resolution ‘fingerprint’ images reveal a weakening Atlantic Ocean circulation (AMOC)
  • Paul Pukite (@whut) on High-resolution ‘fingerprint’ images reveal a weakening Atlantic Ocean circulation (AMOC)
  • Paul Pukite (@whut) on Time and Tide Gauges wait for no Voortman
  • jgnfld on High-resolution ‘fingerprint’ images reveal a weakening Atlantic Ocean circulation (AMOC)
  • jgnfld on High-resolution ‘fingerprint’ images reveal a weakening Atlantic Ocean circulation (AMOC)
  • Mr. Know It All on Unforced variations: Oct 2025
  • Killian on Unforced variations: Oct 2025
  • Killian on Unforced variations: Oct 2025
  • Killian on Unforced variations: Oct 2025
  • Susan Anderson on “But you said the ice was going to disappear in 10 years!”
  • Geoff Miell on High-resolution ‘fingerprint’ images reveal a weakening Atlantic Ocean circulation (AMOC)
  • Martin Smith on High-resolution ‘fingerprint’ images reveal a weakening Atlantic Ocean circulation (AMOC)
  • Martin Smith on High-resolution ‘fingerprint’ images reveal a weakening Atlantic Ocean circulation (AMOC)
  • Geoff Miell on High-resolution ‘fingerprint’ images reveal a weakening Atlantic Ocean circulation (AMOC)
  • Keith Woollard on High-resolution ‘fingerprint’ images reveal a weakening Atlantic Ocean circulation (AMOC)

Footer

ABOUT

  • About
  • Translations
  • Privacy Policy
  • Contact Page
  • Login

DATA AND GRAPHICS

  • Data Sources
  • Model-Observation Comparisons
  • Surface temperature graphics
  • Miscellaneous Climate Graphics

INDEX

  • Acronym index
  • Index
  • Archives
  • Contributors

Realclimate Stats

1,384 posts

11 pages

247,658 comments

Copyright © 2025 · RealClimate is a commentary site on climate science by working climate scientists for the interested public and journalists.