A recent sensible-sounding piece by Roy Spencer for the Heritage foundation is full of misrepresentations. Let’s play spot the fallacy.
[Read more…] about Spencer’s ShenanigansClimate modelling
Not just another dot on the graph? Part II
Annual updates to the model-observation comparisons for 2023 are now complete. The comparisons encompass surface air temperatures, mid-troposphere temperatures (global and tropical, and ‘corrected’), sea surface temperatures, and stratospheric temperatures. In almost every case, the addition of the 2023 numbers was in line with the long term expectation from the models.
[Read more…] about Not just another dot on the graph? Part IINot just another dot on the graph?
As the climate monitoring groups add an additional dot to their graphs this week, there is some disquiet among people paying attention about just how extraordinary 2023 really was.
[Read more…] about Not just another dot on the graph?Annual GMSAT predictions and ENSO
For the last few years (since at least 2016), I’ve shared predictions for the next annual global mean surface air temperature (GMSAT) anomaly based on the long term trend and the state of ENSO at the start of the year. Generally speaking, this has been quite skillful compared to persistence or just the long term trend alone – the eventual anomaly was consistently within the predicted bounds. Until 2023.
[Read more…] about Annual GMSAT predictions and ENSOClauser-ology: Cloudy with a chance of meatballs
John Clauser’s theory of climate explained.

Some of you will have heard of John Clauser because he was an awardee of the 2022 Nobel Prize in Physics for his role in the experimental verification of quantum entanglement. Some of you will have heard of him because the first thing that he did after winning the Nobel was join a climate denial organization and make some rather odd claims about climate science. And some of you will never have heard of him (in which case, feel free to skip this post!).
At no point in his long and, by all accounts, successful, career has he ever published a paper on climate[1]. He has not penned an article, nor even a blog post or a tweet on the topic, and so any scientific basis for his opinions (if any) has been opaque… until recently. In the last few months he has given two interviews in which he goes into to detail about what he describes as a ‘missing element’ in climate science and what he imagines the consequences are for climate change. The first interview was for the Epoch Times (a far right-wing newspaper and media organization affiliated with Falun Gong). The second was a podcast with the somewhat troubled Chris Smith, an Australian journalist. (The material is somewhat similar in each). And more comprehensively, it was repeated in a recent video lecture as well.
And what is this supposed ‘missing element’? Clouds.
[Read more…] about Clauser-ology: Cloudy with a chance of meatballsThe 5th International Conference on Regional Climate
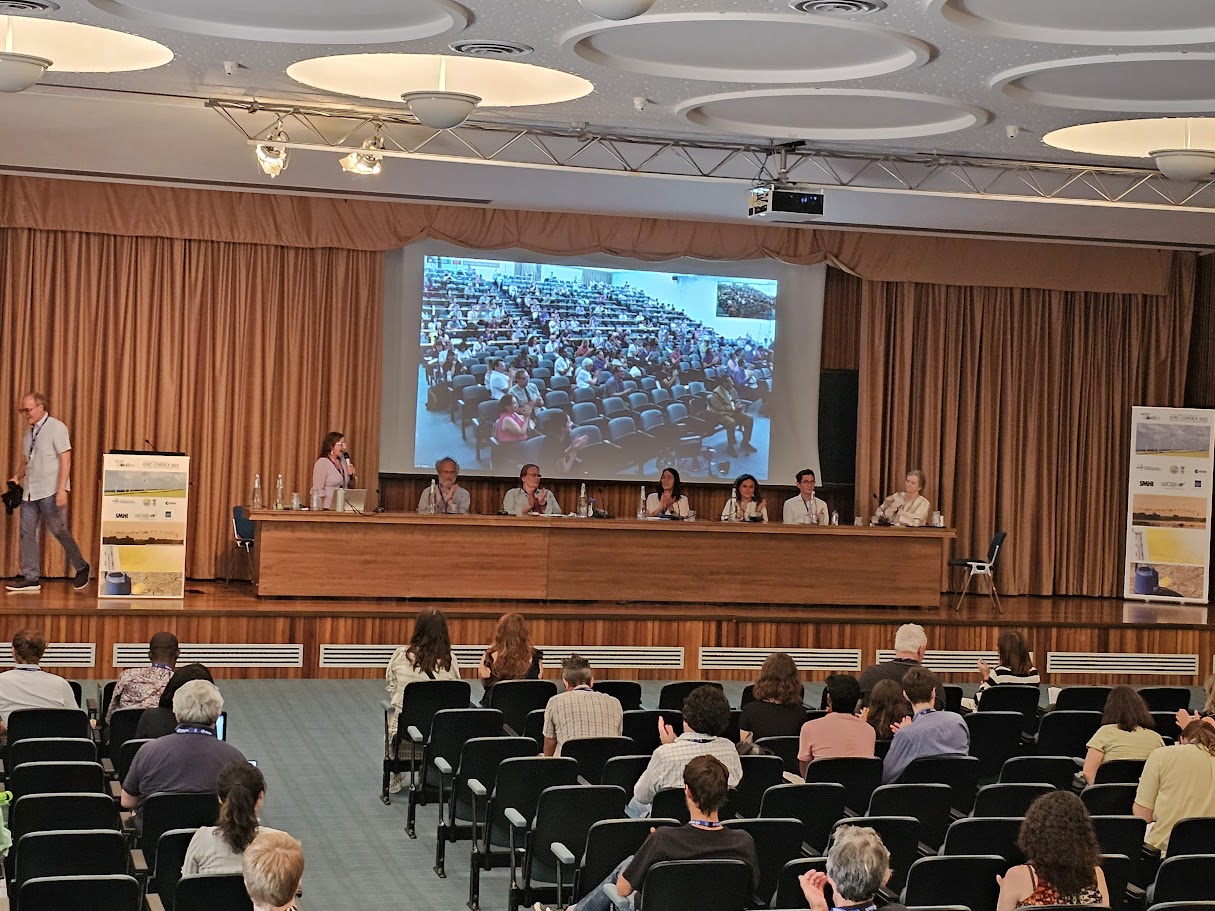
The fifth international conference on regional climate (ICRC 2023), organised by World Climate Research Programme’s (WCRP) coordinated downscaling experiment (CORDEX), has just completed. It was a hybrid on-site/online conference with hubs in both Trieste/Italy (hosted by the International Centre on Theoretical Physics, ICTP) and Pune/India.
The hybrid set-up, with video links between the two hubs and digital attendence through zoom, was a change from previous ICRCs held in ICTP (2011), Brussels (2013), Stockholm (2016), and Beijing (2019). It worked impressively well, and the CORDEX ICRC 2023 streaming is available from the WCRP CORDEX YouTube channel.
It seems as an eternity since the previous ICRC before the COVID pandemic, so I was curious to see how things have progressed since then. It was also interesting to compare my impressions from this conference with my blog posts here on RealClimate from the first ICRC in Trieste, the second in Brussels, the third ICRC in Stockholm, I see that questions concerning uncertainty and added value are still being debated.
The Scafetta Saga
It has taken 17 months to get a comment published pointing out the obvious errors in the Scafetta (2022) paper in GRL.
Back in March 2022, Nicola Scafetta published a short paper in Geophysical Research Letters (GRL) purporting to show through ‘advanced’ means that ‘all models with ECS > 3.0°C overestimate the observed global surface warming’ (as defined by ERA5). We (me, Gareth Jones and John Kennedy) wrote a note up within a couple of days pointing out how wrongheaded the reasoning was and how the results did not stand up to scrutiny.
[Read more…] about The Scafetta SagaReferences
- N. Scafetta, "Advanced Testing of Low, Medium, and High ECS CMIP6 GCM Simulations Versus ERA5‐T2m", Geophysical Research Letters, vol. 49, 2022. http://dx.doi.org/10.1029/2022GL097716
As Soon as Possible
The latest contrarian crowd pleaser from Soon et al (2023) is just the latest repetition of the old “it was the sun wot done it” trope[1] that Willie Soon and his colleagues have been pushing for decades. There is literally nothing new under the sun.
[Read more…] about As Soon as PossibleReferences
- W. Soon, R. Connolly, M. Connolly, S. Akasofu, S. Baliunas, J. Berglund, A. Bianchini, W. Briggs, C. Butler, R. Cionco, M. Crok, A. Elias, V. Fedorov, F. Gervais, H. Harde, G. Henry, D. Hoyt, O. Humlum, D. Legates, A. Lupo, S. Maruyama, P. Moore, M. Ogurtsov, C. ÓhAiseadha, M. Oliveira, S. Park, S. Qiu, G. Quinn, N. Scafetta, J. Solheim, J. Steele, L. Szarka, H. Tanaka, M. Taylor, F. Vahrenholt, V. Velasco Herrera, and W. Zhang, "The Detection and Attribution of Northern Hemisphere Land Surface Warming (1850–2018) in Terms of Human and Natural Factors: Challenges of Inadequate Data", Climate, vol. 11, pp. 179, 2023. http://dx.doi.org/10.3390/cli11090179
Evaluation of GCM simulations with a regional focus.
Do the global climate models (GCMs) we use for describing future climate change really capture the change and variations in the region that we want to study? There are widely used tools for evaluating global climate models, such as the ESMValTool, but they don’t provide the answers that I seek.
I use GCMs to provide information about large-scale conditions, processes and phenomena in the atmosphere that I can use as predictors in downscaling future climate projections. I also want to know whether the ensemble of GCM simulations that I use provides representative statistics of the actual regional climate I’m interested in.
[Read more…] about Evaluation of GCM simulations with a regional focus.CMIP6: Not-so-sudden stratospheric cooling
As predicted in 1967 by Manabe and Wetherald, the stratosphere has been cooling.
A new paper by Ben Santer and colleagues has appeared in PNAS where they extend their previous work on the detection and attribution of anthropogenic climate change to include the upper stratosphere, using observations from the Stratospheric Sounding Units (SSUs) (and their successors, the AMSU instruments) that have flown since 1979.
[Read more…] about CMIP6: Not-so-sudden stratospheric coolingReferences
- B.D. Santer, S. Po-Chedley, L. Zhao, C. Zou, Q. Fu, S. Solomon, D.W.J. Thompson, C. Mears, and K.E. Taylor, "Exceptional stratospheric contribution to human fingerprints on atmospheric temperature", Proceedings of the National Academy of Sciences, vol. 120, 2023. http://dx.doi.org/10.1073/pnas.2300758120