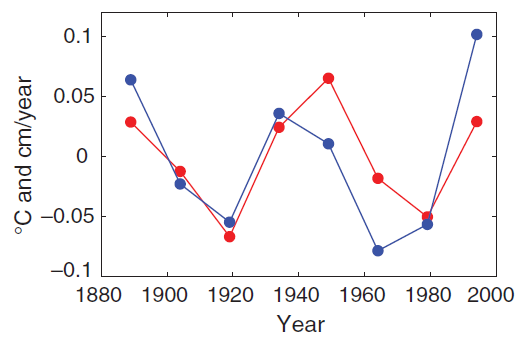
Just a quick note to point out that the HadCRUT4 data are now fully available for download. Feel free to discuss (or point to) any analyses you’d like to see done in the comments, and perhaps we’ll update this post with the more interesting ones.
Instrumental Record
Evaluating a 1981 temperature projection
Guest commentary from Geert Jan van Oldenborgh and Rein Haarsma, KNMI
Sometimes it helps to take a step back from the everyday pressures of research (falling ill helps). It was in this way we stumbled across Hansen et al (1981) (pdf). In 1981 the first author of this post was in his first year at university and the other just entered the KNMI after finishing his masters. Global warming was not yet an issue at the KNMI where the focus was much more on climate variability, which explains why the article of Hansen et al. was unnoticed at that time by the second author. It turns out to be a very interesting read.
[Read more…] about Evaluating a 1981 temperature projection
References
- J. Hansen, D. Johnson, A. Lacis, S. Lebedeff, P. Lee, D. Rind, and G. Russell, "Climate Impact of Increasing Atmospheric Carbon Dioxide", Science, vol. 213, pp. 957-966, 1981. http://dx.doi.org/10.1126/science.213.4511.957
Data presentation: A trend lesson
I just came across an interesting way to eliminate the impression of a global warming. A trick used to argue that the global warming had stopped, and the simple recipe is as follows:
Updating the CRU and HadCRUT temperature data
The latest incarnation of the CRUTEM land surface temperatures and the HadCRUT global temperatures are out this week. This is the 4th version of these products, which have undergone a number of significant changes over that time and so this is a good opportunity to discuss how and why data products evolve and what that means in the bigger scheme of things.
[Read more…] about Updating the CRU and HadCRUT temperature data
Misrepresentation from Lindzen
Richard Lindzen is a very special character in the climate debate – very smart, high profile, and with a solid background in atmospheric dynamics. He has, in times past, raised interesting critiques of the mainstream science. None of them, however, have stood the test of time – but exploring the issues was useful. More recently though, and especially in his more public outings, he spends most of his time misrepresenting the science and is a master at leading people to believe things that are not true without him ever saying them explicitly.
However, in his latest excursion at a briefing at the House of Lords Commons in the UK, among the standard Lindzen arguments was the following slide (which appears to be a new addition):
What Lindzen is purporting to do is to compare the NASA GISS temperature product from 2012 to the version in 2008 (i.e. the y-axis is the supposedly the difference between what GISS estimated the anomaly to be in 2012 relative to 2008). A rising trend would imply that temperatures in more recent years had been preferentially enhanced in the 2012 product. The claim being made is that NASA GISS has ‘manipulated’ (in a bad way) the data in order to produce an increasing trend of global mean temperature anomalies (to the tune of 0.14ºC/Century compared to the overall trend of 0.8ºC/Century) between the 2008 and 2012 versions of the data, which are apparently shown subtracted from each other in Lindzen’s figure. Apparently, this got ‘a big laugh’ at his presentation.
However, this is not in the least bit true: the data are not what he claims, the interpretation is wrong, and the insinuations are spurious.
Bickmore on the WSJ response
Guest commentary from Barry Bickmore (repost)
The Wall Street Journal posted yet another op-ed by 16 scientists and engineers, which even include a few climate scientists(!!!). Here is the editor’s note to explain the context.
Editor’s Note: The authors of the following letter, listed below, are also the signatories of“No Need to Panic About Global Warming,” an op-ed that appeared in the Journal on January 27. This letter responds to criticisms of the op-ed made by Kevin Trenberth and 37 others in a letter published Feb. 1, and by Robert Byer of the American Physical Society in a letter published Feb. 6.
A relative sent me the article, asking for my thoughts on it. Here’s what I said in response.
[Read more…] about Bickmore on the WSJ response
2011 Updates to model-data comparisons
And so it goes – another year, another annual data point. As has become a habit (2009, 2010), here is a brief overview and update of some of the most relevant model/data comparisons. We include the standard comparisons of surface temperatures, sea ice and ocean heat content to the AR4 and 1988 Hansen et al simulations.
[Read more…] about 2011 Updates to model-data comparisons
The AR4 attribution statement
Back in 2007, the IPCC AR4 SPM stated that:
“Most of the observed increase in global average temperatures since the mid-20th century is very likely due to the observed increase in anthropogenic greenhouse gas concentrations.”
This is a clear statement that I think is very well supported and correctly reflects the opinion of most climate scientists on the subject (and was re-affirmed in two recent papers (Jones and Stott, 2011;, Huber and Knutti, 2011)). It isn’t an isolated conclusion from a single study, but comes from an assessment of the changing patterns of surface and tropospheric warming, stratospheric cooling, ocean heat content changes, land-ocean contrasts, etc. that collectively demonstrate that there are detectable changes occurring which we can attempt to attribute to one or more physical causes.
Yet, in a paper just out in BAMS (Curry and Webster, 2011) this statement is apparently evidence that IPCC is unable to deal with uncertainty. Furthermore, Judith Curry has reiterated on her blog that the term ‘most’ is imprecise and undefined. For instance:
Apart from the undefined meaning of “most” in AR4 (which was subsequently clarified by the IPCC), the range 50.1-95% is rather imprecise in the context of attribution.
However, Curry’s argument is far from convincing, nor is it well formed (why is there a cap at 95%?). Nor was it convincing when I discussed the issue with her in the comments at Collide-a-Scape last year where she made similar points. Since the C&W paper basically repeats that argument (as has also been noticed by Gabi Hegerl et al who have a comment on the paper (Hegerl et al.)), it is perhaps worth addressing these specific issues again.
[Read more…] about The AR4 attribution statement
References
- G.S. Jones, and P.A. Stott, "Sensitivity of the attribution of near surface temperature warming to the choice of observational dataset", Geophysical Research Letters, vol. 38, pp. n/a-n/a, 2011. http://dx.doi.org/10.1029/2011GL049324
- M. Huber, and R. Knutti, "Anthropogenic and natural warming inferred from changes in Earth’s energy balance", Nature Geoscience, vol. 5, pp. 31-36, 2011. http://dx.doi.org/10.1038/ngeo1327
- J.A. Curry, and P.J. Webster, "Climate Science and the Uncertainty Monster", Bulletin of the American Meteorological Society, vol. 92, pp. 1667-1682, 2011. http://dx.doi.org/10.1175/2011BAMS3139.1
- G. Hegerl, P. Stott, S. Solomon, and F. Zwiers, "Comment on “Climate Science and the Uncertainty Monster” J. A. Curry and P. J. Webster", Bulletin of the American Meteorological Society, vol. 92, pp. 1683-1685, 2011. http://dx.doi.org/10.1175/BAMS-D-11-00191.1
Curve-fitting and natural cycles: The best part
It is not every day that I come across a scientific publication that so totally goes against my perception of what science is all about. Humlum et al., 2011 present a study in the journal Global and Planetary Change, claiming that most of the temperature changes that we have seen so far are due to natural cycles.
They claim to present a new technique to identify the character of natural climate variations, and from this, to produce a testable forecast of future climate. They project that
the observed late 20th century warming in Svalbard is not going to continue for the next 20–25 years. Instead the period of warming may be followed by variable, but generally not higher temperatures for at least the next 20–25 years.
However, their claims of novelty are overblown, and their projection is demonstrably unsound.
[Read more…] about Curve-fitting and natural cycles: The best part
References
- O. Humlum, J. Solheim, and K. Stordahl, "Identifying natural contributions to late Holocene climate change", Global and Planetary Change, vol. 79, pp. 145-156, 2011. http://dx.doi.org/10.1016/j.gloplacha.2011.09.005
Global Temperature News
There are two interesting pieces of news on the global temperature evolution.
First, today a paper by Grant Foster and Stefan Rahmstorf was published by Environmental Research Letters, providing a new analysis of the five available global (land+ocean) temperature time series. Foster and Rahmstorf tease out and remove the short-term variability due to ENSO, solar cycles and volcanic eruptions and find that after this adjustment all five time series match much more closely than before (see graph). That’s because the variability differs between the series, for example El Niño events show up about twice as strongly in the satellite data as compared to the surface temperatures. In all five adjusted series, 2009 and 2010 are the two warmest years on record. For details have a look over at Tamino’s Open Mind.
[Read more…] about Global Temperature News
References
- G. Foster, and S. Rahmstorf, "Global temperature evolution 1979–2010", Environmental Research Letters, vol. 6, pp. 044022, 2011. http://dx.doi.org/10.1088/1748-9326/6/4/044022