What is happening to sea levels? That was perhaps the most controversial issue in the 4th IPCC report of 2007. The new report of the Intergovernmental Panel on Climate Change is out now, and here I will discuss what IPCC has to say about sea-level rise (as I did here after the 4th report).
Let us jump straight in with the following graph which nicely sums up the key findings about past and future sea-level rise: (1) global sea level is rising, (2) this rise has accelerated since pre-industrial times and (3) it will accelerate further in this century. The projections for the future are much higher and more credible than those in the 4th report but possibly still a bit conservative, as we will discuss in more detail below. For high emissions IPCC now predicts a global rise by 52-98 cm by the year 2100, which would threaten the survival of coastal cities and entire island nations. But even with aggressive emissions reductions, a rise by 28-61 cm is predicted. Even under this highly optimistic scenario we might see over half a meter of sea-level rise, with serious impacts on many coastal areas, including coastal erosion and a greatly increased risk of flooding.
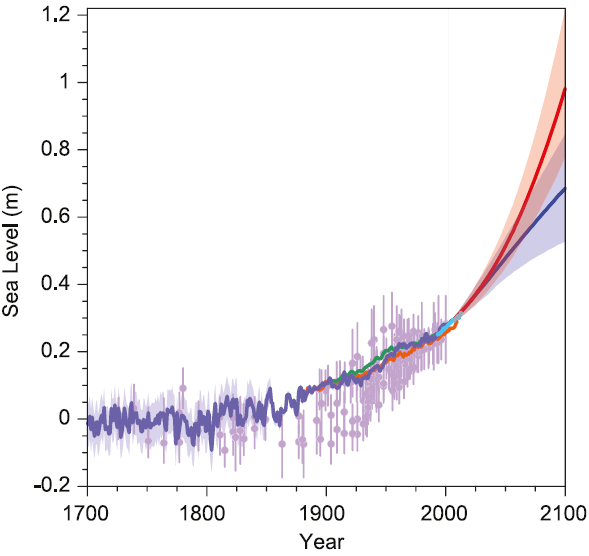
Fig. 1. Past and future sea-level rise. For the past, proxy data are shown in light purple and tide gauge data in blue. For the future, the IPCC projections for very high emissions (red, RCP8.5 scenario) and very low emissions (blue, RCP2.6 scenario) are shown. Source: IPCC AR5 Fig. 13.27.
[Read more…] about Sea level in the 5th IPCC report