by Jill and David Archer
Climate science from climate scientists...
There has been an unusual surge of interest in the climate sensitivity based on the last decade’s worth of temperature measurements, and a lengthy story in the Economist tries to argue that the climate sensitivity may be lower than previously estimated. I think its conclusion is somewhat misguided because it missed some important pieces of information (also see skepticalscience’s take on this story here).

While the Economist referred to some unpublished work, it missed a new paper by Balmaseda et al. (2013) which provides a more in-depth insight. Balmaseda et al suggest that the recent years may not have much effect on the climate sensitivity after all, and according to their analysis, it is the winds blowing over the oceans that may be responsible for the ‘slow-down’ presented in the Economist.
[Read more…] about The answer is blowing in the wind: The warming went into the deep end
Guest commentary by Darrell Kaufman (N. Arizona U.)
In a major step forward in proxy data synthesis, the PAst Global Changes (PAGES) 2k Consortium has just published a suite of continental scale reconstructions of temperature for the past two millennia in Nature Geoscience. More information about the study and its implications are available at the FAQ on the PAGES website and the datasets themselves are available at NOAA Paleoclimate.
The main conclusion of the study is that the most coherent feature in nearly all of the regional temperature reconstructions is a long-term cooling trend, which ended late in the 19th century, and which was followed by a warming trend in the 20th C. The 20th century in the reconstructions ranks as the warmest or nearly the warmest century in all regions except Antarctica. During the last 30-year period in the reconstructions (1971-2000 CE), the average reconstructed temperature among all of the regions was likely higher than anytime in at least ~1400 years. Interestingly, temperatures did not fluctuate uniformly among all regions at multi-decadal to centennial scales. For example, there were no globally synchronous multi-decadal warm or cold intervals that define a worldwide Medieval Warm Period or Little Ice Age. Cool 30-year periods between the years 830 and 1910 CE were particularly pronounced during times of weak solar activity and strong tropical volcanic eruptions and especially if both phenomena often occurred simultaneously.
[Read more…] about The PAGES-2k synthesis
Eric Steig
It is well known that ice shelves on the Antarctic Peninsula have collapsed on several occasions in the last couple of decades, that ice shelves in West Antarctica are thinning rapidly, and that the large outlet glaciers that drain the West Antarctic ice sheet (WAIS) are accelerating. The rapid drainage of the WAIS into the ocean is a major contributor to sea level rise (around 10% of the total, at the moment).
All of these observations match the response, predicted in the late 1970s by glaciologist John Mercer, of the Antarctic to anthropogenic global warming. As such, they are frequently taken as harbingers of greater future sea level rise to come. Are they?
Two papers published this week in Nature Geoscience provide new information that helps to address this question. One of the studies (led by me) says “probably”, while another (Abram et al.) gives a more definitive “yes”. [Read more…] about Ice hockey
Guest post by Geert Jan van Oldenborgh, Francisco Doblas-Reyes, Sybren Drijfhout and Ed Hawkins
Climate information for the future is usually presented in the form of scenarios: plausible and consistent descriptions of future climate without probability information. This suffices for many purposes, but for the near term, say up to 2050, scenarios of emissions of greenhouse gases do not diverge much and we could work towards climate forecasts: calibrated probability distributions of the climate in the future.
This would be a logical extension of the weather, seasonal and decadal forecasts in existence or being developed (Palmer, BAMS, 2008). In these fields a fundamental forecast property is reliability: when the forecast probability of rain tomorrow is 60%, it should rain on 60% of all days with such a forecast.
This is routinely checked: before a new model version is introduced a period in the past is re-forecast and it is verified that this indeed holds. In seasonal forecasting a reliable forecast is often constructed on the basis of a multi-model ensemble, as forecast systems tend to be overconfident (they underestimate the actual uncertainties).
[Read more…] about Verification of regional model trends

Some of my friends have made a film, Thin Ice, which tells the story of CO2 and climate from the standpoint of the climate scientists who are out there in the trenches trying to figure out what is going on. I have a small role in the film myself, and I am sure RealClimate readers will recognize many more familiar faces. One of the many things I like about this film is that it puts a human face on climate science. It’s harder to demonize people when you feel you know them, and realize that in the end they’re not that different from you and your neighbors (except maybe they know more about CO2 and climate than some others you might meet).
A description of the project, including trailers and clips can be found here . The film will be available during Earth Week for free streaming. Or even better, you can arrange a free screening for your group (details for obtaining a free Earth Week download for screening are available here ). Read below the fold for more information
Kerr (2013) recently provided a critical review of regional climate models (“RCMs”). I think his views have caused a stir in the regional climate model community. So what’s the buzz all about?
RCMs provide important input to many climate services, for which there is a great deal of vested interest on all levels. On the international stage, high-level talks lead to the establishment of a Global Framework for Climate Services (GFCS) during the World Climate Conference 3 (WCC3) in Geneva 2009.
[Read more…] about Should regional climate models take the blame?
This year, the Geological Society of America is rolling out their SWITCH Energy Awareness campaign . The centerpiece of the campaign is a documentary film, SWITCH, which purports to be about the need for a transformation in the world’s energy systems. Recently, I attended the Chicago premier of the film, presented as part of the Environmental Film Series of the Lutheran School of Theology. I had high hopes for this film. They were disappointed. Given the mismatch between what the movie promises and what it delivers, it would be more aptly titled, “BAIT AND SWITCH.”
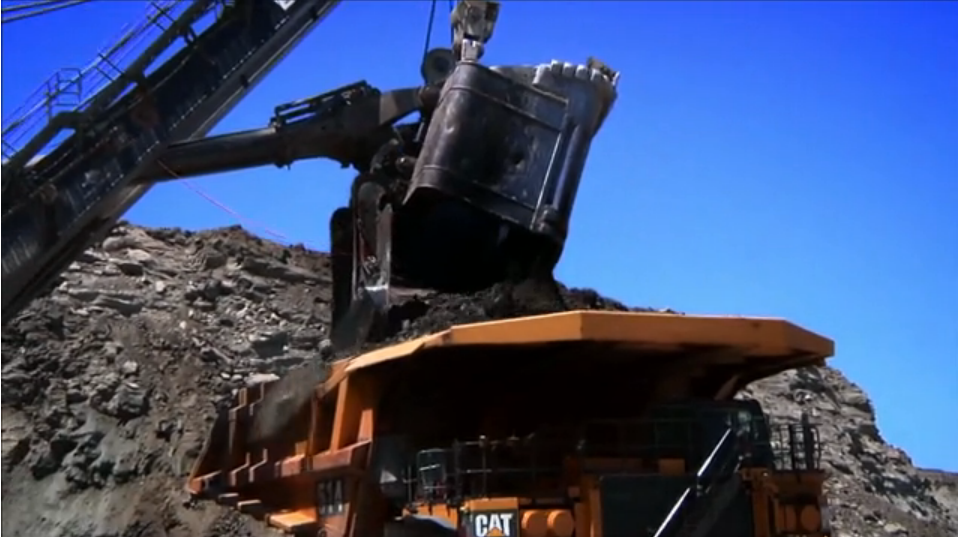
[Read more…] about Movie review: SWITCH