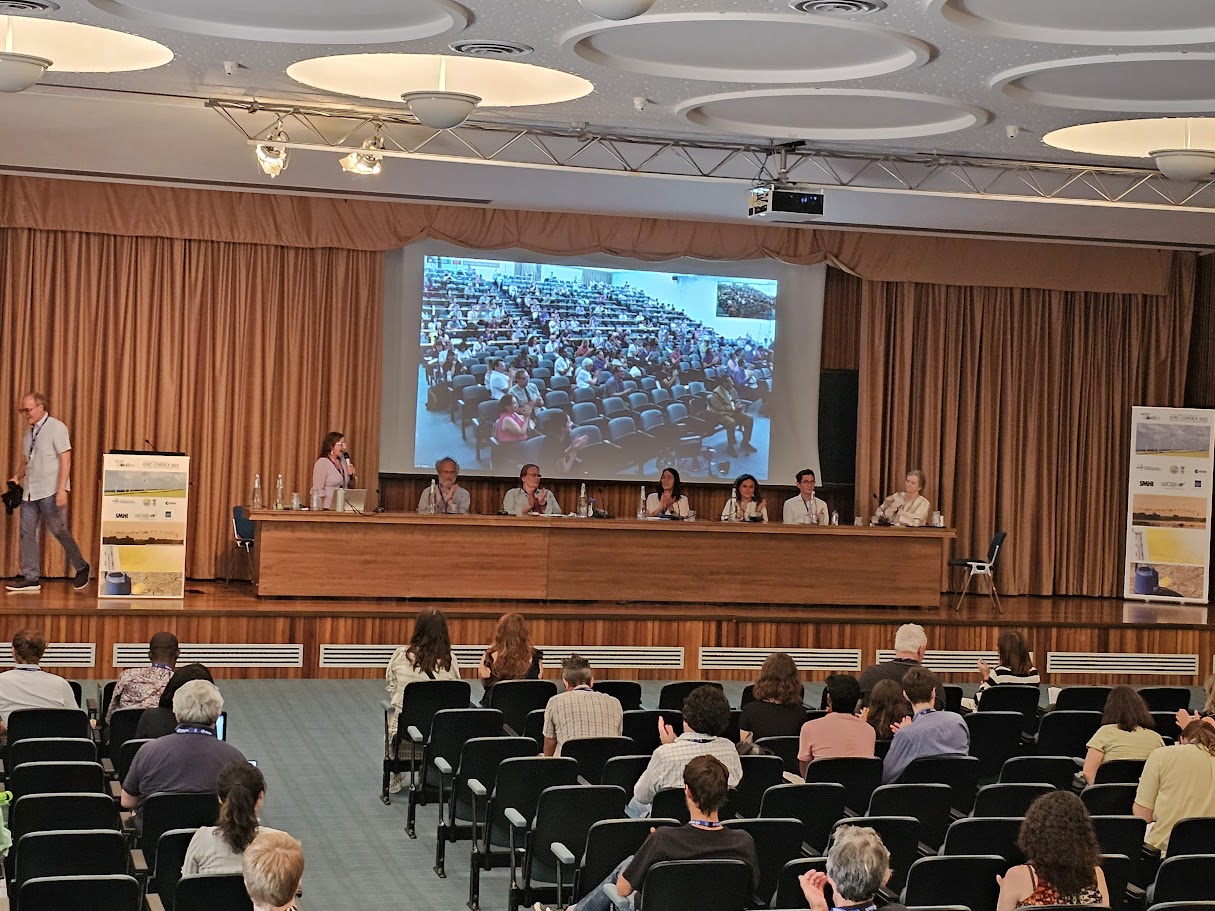
Media awareness about global warming and climate change has grown fairly steadily since 2004. My impression is that journalists today tend to possess a higher climate literacy than before. This increasing awareness and improved knowledge is encouraging, but there are also some common interpretations which could be more nuanced. Here are two examples, polar amplification and extreme rainfall.
[Read more…] about Old habitsClimate Science
The Scafetta Saga
It has taken 17 months to get a comment published pointing out the obvious errors in the Scafetta (2022) paper in GRL.
Back in March 2022, Nicola Scafetta published a short paper in Geophysical Research Letters (GRL) purporting to show through ‘advanced’ means that ‘all models with ECS > 3.0°C overestimate the observed global surface warming’ (as defined by ERA5). We (me, Gareth Jones and John Kennedy) wrote a note up within a couple of days pointing out how wrongheaded the reasoning was and how the results did not stand up to scrutiny.
[Read more…] about The Scafetta SagaReferences
- N. Scafetta, "Advanced Testing of Low, Medium, and High ECS CMIP6 GCM Simulations Versus ERA5‐T2m", Geophysical Research Letters, vol. 49, 2022. http://dx.doi.org/10.1029/2022GL097716
As Soon as Possible
The latest contrarian crowd pleaser from Soon et al (2023) is just the latest repetition of the old “it was the sun wot done it” trope[1] that Willie Soon and his colleagues have been pushing for decades. There is literally nothing new under the sun.
[Read more…] about As Soon as PossibleReferences
- W. Soon, R. Connolly, M. Connolly, S. Akasofu, S. Baliunas, J. Berglund, A. Bianchini, W. Briggs, C. Butler, R. Cionco, M. Crok, A. Elias, V. Fedorov, F. Gervais, H. Harde, G. Henry, D. Hoyt, O. Humlum, D. Legates, A. Lupo, S. Maruyama, P. Moore, M. Ogurtsov, C. ÓhAiseadha, M. Oliveira, S. Park, S. Qiu, G. Quinn, N. Scafetta, J. Solheim, J. Steele, L. Szarka, H. Tanaka, M. Taylor, F. Vahrenholt, V. Velasco Herrera, and W. Zhang, "The Detection and Attribution of Northern Hemisphere Land Surface Warming (1850–2018) in Terms of Human and Natural Factors: Challenges of Inadequate Data", Climate, vol. 11, pp. 179, 2023. http://dx.doi.org/10.3390/cli11090179
Unforced variations: Sep 2023
This month’s open thread on climate science topics. It’s been a warm summer, dontcha know? Expect ERA5, the satellite data and then the surface data products to confirm this in the next week or so. Sea ice minimum in the Arctic will also occur soon, as will a record low maximum in the Antarctic. El Niño still building in the tropical Pacific. Interesting times…
The AMOC: tipping this century, or not?
A few weeks ago, a study by Copenhagen University researchers Peter and Susanne Ditlevsen concluded that the Atlantic Meridional Overturning Circulation (AMOC) is likely to pass a tipping point already this century, most probably around mid-century. Given the catastrophic consequences of an AMOC breakdown, the study made quite a few headlines but also met some skepticism. Now that the dust has settled, here some thoughts on the criticisms that have been raised about this study.
[Read more…] about The AMOC: tipping this century, or not?Unforced Variations: Aug 2023
What is happening in the Atlantic Ocean to the AMOC?
For various reasons I’m motivated to provide an update on my current thinking regarding the slowdown and tipping point of the Atlantic Meridional Overturning Circulation (AMOC). I attended a two-day AMOC session at the IUGG Conference the week before last, there’s been interesting new papers, and in the light of that I have been changing my views somewhat. Here’s ten points, starting from the very basics, so you can easily jump to the aspects that interest you.

Area-based global hydro-climatological indicators
The World Meteorological Organisation (WMO) Global Climate Observing System (GCOS) and Copernicus Climate Change Services (C3S) both provide sets of global climate statistics to summarise the state of Earth’s climate. They are indeed valuable indicators for the global or regional mean temperature, greenhouse gas concentrations, both ice volume and area, ocean heat, acidification, and the global sea level.
Still, I find it surprising that the set does not include any statistics on the global hydrological cycle, relevant to rainfall patterns and droughts. Two obvious global hydro-climatological indicators are the total mass of water falling on Earth’s surface each day P and the fraction of Earth’s surface area on which it falls Ap.
[Read more…] about Area-based global hydro-climatological indicatorsBack to basics
You can tell how worried the climate deniers are by how many fields of science they have to trash to try and have people not see what’s happening.
it will not have escaped most people’s notice that global temperatures are heading into uncharted territory. The proximate cause of this week’s headlines is the Climate Reanalyzer website at the U. Maine which provides a nice front end to the NOAA NCEP CFS forecast system and reanalysis and shows absolute daily temperatures in early July clearly exceeding the highest pre-existing temperatures from August 2016. It’s an arresting graphic, and follows in from the record high ocean surface temperatures that were being reported a month ago.

This is however a relatively new resource and was not online the last time that we set absolute temperature records (in summer 2016). So this has both salience and novelty – a potent combination!
The ultimate cause of these patterns is of course the ongoing global warming, driven almost entirely by human activities.
What are we looking at?
As we’ve explained before, all global temperature products are based on some kind of model – statistical, physical etc. There is no direct measurement of the global temperature – not from satellites, stations, or from the one random person who happens to be in most average place on Earth (where might that even be?). But that doesn’t mean the products aren’t useful!
In this particular instance we are looking at the output of a weather forecast model (NCEP CFS) that ingests multiple sources of in situ and satellite data every 3 hours which is then averaged over a day and over the surface of the planet. These calculations are precise reflections of what is in the model, but for multiple reasons this might not be a perfect reflection of what the real world is doing.
We looked at the coherence of different products, including the reanalyses, before and found that while they are highly correlated in terms of annual anomalies, they differ in their absolute magnitude (graphic from 2017).

Differences will depend on resolution – higher resolution models have better (and higher topography) and then will have slightly cooler temperatures (all else being equal – which it isn’t!), tuning, model structure etc. and can’t really be discriminated using the pure (sparse) observations.
Coherence at the monthly scale is also quite good (though a little noisier), and I haven’t (yet) seen a good comparison of the coherence of the different products at the daily scale (note that the standard products (like GISTEMP, HadCRUT5 and NOAAv5) don’t produce a daily product). One might anticipate that there is a similarity, but perhaps not a one-to-one correspondence on exactly which days were the warmest.

What are we seeing?
For the global temperature, it’s well established that the maximum is during the Northern Hemisphere summer. This sometimes comes as a surprise to people (why doesn’t the opposing seasonality in the Southern Hemisphere cancel this out?), but it relates to the fact that there is a lot more land in the Northern Hemisphere. Since the seasonal cycle over land is much larger than over the ocean (smaller heat capacity, and less evaporation), that means that the seasonal variations in the north outweigh the variations in the south.
Thus the months of July and August are generally the warmest in the year, and consequently we expect the warmest days during those months – and this is reflected in the CFS output (and in the ERA5 output also). The monthly variations are also reflected in the GISTEMP product which allows you to see the shifts from 1880 onward (about a 1ºC warming in each month since the late 19th C):

The station-based products are a little delayed with respect to the reanalyses, but they generally reflect the same patterns – thus one should expect the June temperatures in NOAA, GISTEMP and HadCRUT5 to be the warmest June on record. Given too, that these temperatures are being driven by persistent warming in the oceans, increasingly juiced by the growing El Niño event in the tropical Pacific, records in July and August are also likely. This is of course increasing the odds for 2023 to be a record year (I would estimate about 50% at this point).
But the WSJ Opinion page says that there’s no such thing as the global temperature!
Well, they would say that wouldn’t they. [Narrator: there is, in fact, a perfectly well defined global mean of any two-dimensional field defined on the sphere, including temperature].
More generously, one might think that their argument (such as it is), is that the global mean isn’t directly relevant for anyone. That is, no-one lives in the global mean, all impacts are local and driven by weather variations. But we’ve known for decades that the global mean change is a really good predictor (not perfect, but pretty good) of local impacts on heat waves, intense rainfall, drought intensity etc.
But let’s be honest, it’s basically pure distraction and attempts to complicate something that is pretty basic:
The climate is warming, records are being broken, and we are increasingly seeing the impacts.
I know why the WSJ doesn’t want you to realise this, but it’s not hard to see past their obfuscation.