Guest commentary by Robert Hart, Kerry Emanuel, & Lance Bosart
The National Weather Service (NWS) and its parent agency, the National Oceanic and Atmospheric
Administration (NOAA), delivers remarkable value to the taxpayers. This efficiency can be demonstrated by its enormous return on investment. For example, the NWS costs only several dollars per citizen to operate each year, yet results in an estimated 10-100 times larger financial return that includes: improved citizen preparedness, improved transportation efficiency and safety, increased private sector profits, improved disaster prevention and mitigation, and impressive scientific research innovation that is significantly also contributed to by other related federal agencies, the private sector, and the academic research community.
Recent NWS initiatives have even more directly connected weather and ocean observations and forecasts to emergency preparation and public impact. To quote a 2019 study referenced below, “Partnership with the NWS has revolutionized this Emergency Management community from on that reacts to events to one that proactively prepares and stays ahead of the extreme events.” The societal benefits of reasonably predicting the future cannot be understated, and such prediction and resulting benefits were unimaginable only 75 years ago.
Critical taxpayer-funded investments over the past decades have led to greatly improved weather forecast models, observations from the ocean, ground, aircraft, and space, and theoretical understanding through scientific research. These all have had an enormous impact on lives and property. The forecasts and associated critical watches and warnings we see every day on television, the internet, or phone apps could not be possible without NOAA and the NWS. It is estimated that the tax revenue generated from the private sector using NOAA data and services easily pays for the entire cost of the NWS.
Those who remember weather forecasts from the 1970s through 1980s can appreciate these dramatic evolutionary improvements given how inferior those forecasts were compared to today. Going further back, landfalling hurricanes in the first half of that century often came with no warning. If you read newspaper front pages from the mornings of September 7, 1900, or September 21, 1938, you will find there is no mention of the historic and catastrophic events about to unfold only hours later. This would be unthinkable today given the scientific investments we have paid for.
These massive improvements extend beyond hurricane (and also snowstorm) forecasting and preparedness. Tornado warning lead time has also improved markedly during the same time period. Casualty rates from tornadoes have not increased despite a very rapid increase in population. At minimum, hundreds of thousands of people are alive today who would not be without our investments in NOAA and NWS.
The advent of skillful weather forecasting, along with the increased preparedness it allows, remains a landmark achievement of not only this country but of the human race. There are few other fields in the sciences where skillful prediction not only has had immense impact on our society, but is even possible. We should be extraordinarily proud of this achievement.
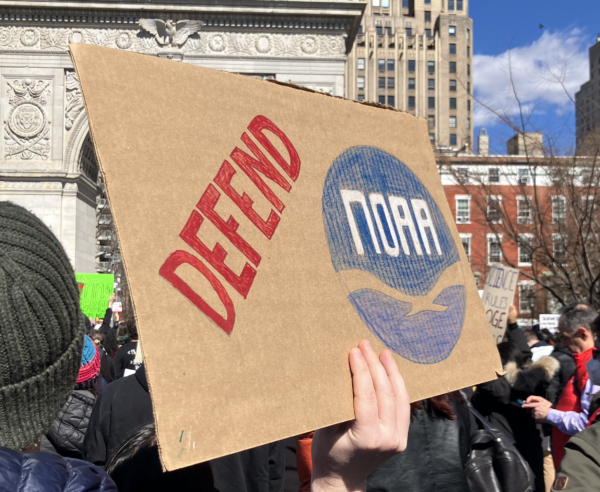
The current expulsion of primarily younger NOAA employees without cause and with disturbingly short notice is cruel to them personally and professionally. The youngest employees are the future of any organization, government or otherwise, and bring with them unique energy, skills, and ideas. Every government organization should strive to become more efficient, and must be subjected to careful oversight, since taxpayer funding is precious and entrusted to the government by the people. However, the instrument of wise oversight is the scalpel, not the chainsaw. The recent seemingly arbitrary and capricious reductions, notably made without Congressional oversight, are seriously jeopardizing the future of the country and more generally the property and lives of hundreds of millions of tax-paying families who have invested in these truly remarkable achievements over many decades.
References:
“Evolving the National Weather Service to Build a Weather-Ready Nation: Connecting
Observations, Forecasts, and Warnings to Decision-Makers through Impact-Based Decision
Support Services”, Bulletin of the American Meteorological Society, October 2019.
“Using the National Weather Service’s impact-based decision support services to prepare for
extreme winter storms“, Journal of Emergency Management, November/December 2019.
“Impact-Based Decision Support Services (IDSS) and Socioeconomic Impacts of Winter Storms”,
Bulletin of the American Meteorological Society, May 2020.
“Communicating Forecast Uncertainty (CoFU) 2: Replication and Extension of a Survey of the US
Public’s Sources, Perceptions, Uses, and Values for Weather Information.” American
Meteorological Society Policy Program Study, September 2024.
“The Social Value of Hurricane Forecasts”, SSRN Journal, December 2024.