• Skip to primary navigation
  • Skip to main content
  • Skip to primary sidebar
  • Skip to footer

RealClimate

Climate science from climate scientists...

  • Start here
  • Model-Observation Comparisons
  • Miscellaneous Climate Graphics
  • Surface temperature graphics
You are here: Home / Archives for 2022

Archives for 2022

The water south of Greenland has been cooling, so what causes that?

17 Dec 2022 by Stefan

Sea surface temperature trend 1993 – 2018, from European Atlas of the Seas

Let’s compare two possibilities by a back-of-envelope calculation.

(1) Is it due to a reduced heat transport of the Atlantic Meridional Overturning Circulation (AMOC)?

(2) Or is it simply due to the influx of cold meltwater as the Greenland Ice Sheet is losing ice?

The latter is often suggested. The meltwater also contributes indirectly to slowing the AMOC, but not because it is cold but because it is freshwater (not saline), which contributes to the first option (i.e. AMOC decline).

AMOC heat transport

For that we take the AMOC flow rate times the temperature difference of 15 °C between the northward upper branch and southward deep return flow to obtain the heat transport.

17,000,000 m3/s x 15 K x 1025 kg/m3 x 4 kJ/kgK = 1 PW (1)

(Here, 1 PW = 1015 Watt and 4 kJ/kgK is the heat capacity of water.)

An AMOC weakening by 15 % thus cools the region at a rate of 0.15 PW = 1.5 x 10¹⁴ W and according to model simulations can fully explain the observed cooling trend (2). Of course, this slowdown is not only due to Greenland meltwater – other factors like increasing precipitation probably play a larger role, but the impact of Greenland melting is not negligible, as we argue in (3).

Greenland ice melt

Here we start by taking the Greenland mass loss rate into the ocean, times the temperature difference between the meltwater and the water it replaces. Note we are interested in the longer-term temperature trend over decades over the region with the meltwater properly mixed in, not at some temporary patches of meltwater floating locally at the surface.

Total Greenland mass loss has been on average 270 Gt/year for the last two decades (4).

Most of that evaporates though, and what ends up in the ocean of this, according to a recent study by Jason Box (5), is around 100 Gt/year, about 30% of which in form of ice and 70% in form of meltwater.

100 Gt/year = 3000 tons/second – that sounds a lot but the AMOC flow is more than 5000 times larger.

Assuming the ice and meltwater runoff occurs at 0 °C and replaces water that is 10 °C (a very high assumption corresponding to summer conditions and not the long-term average), the cooling rate is:

3,000,000 kg/s x 10 K x 4 kJ/kgK = 1.2 x 10¹¹ W

So in comparison, the cooling effect of a 15 % AMOC slowdown is over 1,000 times larger than the direct cooling effect of the Greenland meltwater.

For the part entering the ocean as ice, we must also consider that to melt ice requires energy. The heat of fusion of water is 334 kJ/kg so that adds 900 tons/s x 334 kJ/kg = 3 x 10¹¹ W.

So it turns out that those suggesting that ‘cold’ meltwater might cause the cold blob in the northern Atlantic are doubly wrong: if we talk about the direct impact of stuff coming off Greenland, than ice is the dominant factor and the energy that’s required to melt the ice. But both the direct effect of meltwater and of icebergs entering the ocean are completely dwarfed by the weakening of the AMOC (regardless of whether we take the numbers of Box et al. or other estimates). And Greenland’s contribution to that is not because the meltwater is ‘cold’, but because it is fresh – it contains no salt and dilutes the saltiness of the ocean water, thereby reducing its density.

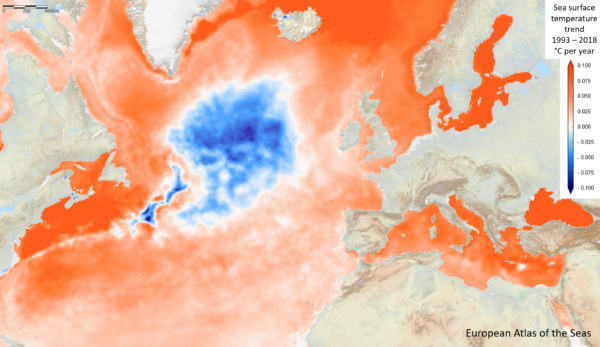
As an additional observation: the cooling patch shown above often vanishes in summer, covered up by a warm surface layer – just when the Greenland melt season is on – only to resurface when deeper mixing starts in autumn. Which again supports the idea that it is not due to a direct effect of cold meltwater influx. Also compare the temperature change directly at the Greenland coast, where the meltwater enters, in the image above.

Finally, some have suggested that the cold blob south of Greenland has been caused by increased heat loss to the atmosphere. That of course is relevant for short-term weather variability – if a cold wind blows over the ocean it will of course cool the surface – but I do not think it can explain the long-term trend, as we discussed earlier here at Realclimate.

References

1.            Trenberth, K. E. & Fasullo, J. T. (2017) Atlantic meridional heat transports computed from balancing Earth’s energy locally, Geophys. Res. Let. 44: 1919-1927.

2.            Caesar, L., Rahmstorf, S., Robinson, A., Feulner, G., & Saba, V. (2018) Observed fingerprint of a weakening Atlantic Ocean overturning circulation, Nature 556: 191-196.

3.            Rahmstorf, S., J.E. Box, G. Feulner, M.E. Mann, A. Robinson, S. Rutherford, and E.J. Schaffernicht, 2015: Exceptional twentieth-century slowdown in Atlantic Ocean overturning circulation. Nature Climate Change, 5, 475–480, doi:10.1038/nclimate2554.

4.            NASA Vital Signs, https://climate.nasa.gov/vital-signs/ice-sheets/

5.            Box, J. E., et al. (2022), Greenland ice sheet climate disequilibrium and committed sea-level rise, Nature Clim. Change, 12(9), 808-813, doi: 10.1038/s41558-022-01

Filed Under: Climate Science

Unforced variations: Dec 2022

3 Dec 2022 by group

This month’s open thread for climate discussions. Please be constructive and polite.

Filed Under: Climate Science, Open thread, Solutions

Serious mistakes found in recent paper by Connolly et al.

29 Nov 2022 by rasmus

Guest post by Mark Richardson who is a Research Scientist in the Aerosol and Clouds Group at NASA’s Jet Propulsion Laboratory, California Institute of Technology. All opinions expressed are his own and do not in any way represent those of NASA, JPL or Caltech.

Should scientists choose to believe provably false things? Even though that would mean more inclusive debates with a wider range of opinions, our recent paper Richardson & Benestad (2022) argues no: “instead of repeating errors, they should be acknowledged and corrected so that the debate can focus on areas of legitimate scientific uncertainty”. We were responding to Connolly et al., who suggested that maybe the Sun caused “most” of the warming in “recent decades” based on a simple maths mistake. 

[Read more…] about Serious mistakes found in recent paper by Connolly et al.

References

  1. M.T. Richardson, and R.E. Benestad, "Erroneous use of Statistics behind Claims of a Major Solar Role in Recent Warming", Research in Astronomy and Astrophysics, vol. 22, pp. 125008, 2022. http://dx.doi.org/10.1088/1674-4527/ac981c

Filed Under: Climate Science, Instrumental Record, Scientific practice, skeptics, statistics, Sun-earth connections

Unforced variations: Nov 2022

1 Nov 2022 by group

This month’s open thread. Anyone read Greta Thunberg’s book? or have an opinion about soup?

Be substantive, be polite, be talking about climate.

Filed Under: Climate Science, Open thread Tagged With: greta thunberg

The #ConcordOslo2022 workshop

25 Oct 2022 by rasmus

In recent years, the idea of climate change adaptation has received more and more attention and has become even more urgent with the unfolding of a number of extreme weather-related calamities. I wrote a piece on climate change adaptation last year here on RealClimate, and many of the issues that I pointed to then are still relevant. 

The dire consequences of flooding, droughts and heatwaves that we have witnessed the last couple of years suggest that our society is not yet adapted even to the current climate. One interesting question is whether the climate science community is ready to provide robust and reliable information to support climate change adaptation when the world finally realises the urgency to do so. In other words, we need to know how to use the best available information the right way. 

[Read more…] about The #ConcordOslo2022 workshop

Filed Under: Climate Science Tagged With: climate change, Climate Change adaptation, Downscaling, Impacts, REgional climate modelling

Scafetta comes back for more

10 Oct 2022 by Gavin

A new paper from Scafetta and it’s almost as bad as the last one.

Back in March, we outlined how a model-observations comparison paper in GRL by Nicola Scafetta (Scafetta, 2022a) got wrong basically everything that one could get wrong (the uncertainty in the observations, the internal variability in the models, the statistical basis for comparisons – the lot!). Now he’s back with a new paper in a different journal (Scafetta, 2022b) that could be seen as trying to patch the holes in the first one, but while he makes some progress, he now adds some new errors while attempting CPR on his original conclusions.

[Read more…] about Scafetta comes back for more

References

  1. N. Scafetta, "Advanced Testing of Low, Medium, and High ECS CMIP6 GCM Simulations Versus ERA5‐T2m", Geophysical Research Letters, vol. 49, 2022. http://dx.doi.org/10.1029/2022GL097716
  2. N. Scafetta, "CMIP6 GCM ensemble members versus global surface temperatures", Climate Dynamics, vol. 60, pp. 3091-3120, 2022. http://dx.doi.org/10.1007/s00382-022-06493-w

Filed Under: Climate modelling, Climate Science, El Nino, Featured Story, Instrumental Record, Scientific practice, statistics Tagged With: CMIP6, misinformation, Scafetta

Unforced variations: Oct 2022

7 Oct 2022 by group

This month’s open thread on climate-related topics (sorry for the slight delay in setting it up). As usual, try to limit yourself to one comment a day, don’t be unnecessarily aggressive and try to be substantive.

Filed Under: Climate Science, Open thread, Solutions

New misguided interpretations of the greenhouse effect from William Kininmonth

1 Oct 2022 by rasmus

I have a feeling that we are seeing the start of a new wave of climate change denial and misrepresentation of science. At the same time, CEOs of gas and oil companies express optimism for further exploitation of fossil energy in the wake of Russia’s invasion of Ukraine, at least here in Norway.

Another clue is William Kininmonth’s ‘rethink’ on the greenhouse effect for The Global Warming Policy Foundation. He made some rather strange claims, such as that the Intergovernmental Panel on Climate  Change (IPCC) allegedly should have forgotten that the earth is a sphere because “most absorption of solar radiation takes place over the tropics, while there is excess emission of longwave radiation to space over higher latitudes”. 

[Read more…] about New misguided interpretations of the greenhouse effect from William Kininmonth

Filed Under: Climate modelling, Climate Science, Communicating Climate, Greenhouse gases, IPCC, Scientific practice, skeptics Tagged With: climate change, co2, greenhouse warming

Watching the detections

25 Sep 2022 by Gavin

The detection and the attribution of climate change are based on fundamentally different frameworks and shouldn’t be conflated.

We read about and use the phrase ‘detection and attribution’ of climate change so often that it seems like it’s just one word ‘detectionandattribution’ and that might lead some to think that it is just one concept. But it’s not.

[Read more…] about Watching the detections

Filed Under: Climate impacts, Climate modelling, Climate Science, climate services, Featured Story, heatwaves, Instrumental Record, IPCC, statistics Tagged With: attribution, detection, extreme events

A CERES of fortunate events…

18 Sep 2022 by Gavin

The CERES estimates of the top-of-atmosphere radiative fluxes are available from 2001 to the present. That is long enough to see that there has been a noticeable trend in the Earth’s Energy Imbalance (EEI), mostly driven by a reduction in the solar radiation reflected by the planet, while the outgoing long wave radiation does not appear to contribute much. But what can be causing this?

A paper last year (Goode et al., 2021) also reported on a two decade estimate of Earthshine measurements which appear to confirm a small decrease in albedo (and decrease in reflected short wave (SW) radiation). While the two measurements are subtly different due to the distinct geometries, they do show sufficient coherence to give us some confidence that they are real.

Comparison of CERES SWup trends (blue) with inferred changes in Earthshine (black).

Similarly, Loeb et al. (2021) show that the trends in the EEI derived from CERES match what you get from the changes in ocean heat content.

Satellite-derived trends in EEI compared to estimates from changes in ocean heat (updated by Schmidt et al, 2023).

A few people have started to interpret the dominance of the SW trends to imply that the overall trends in climate are not (despite copious evidence) being driven by the rise in greenhouse gases (for instance, the rather poorly argued and seemingly un-copyedited Dübal and Vahrenholt (2021)) but these simplistic interpretations are seriously confused.

We can explore the issues and pitfalls of this using the ‘simple model’ of the greenhouse effect we explored back in 2007. At that time, we said:

You should think of these kinds of exercises as simple flim-flam detectors – if someone tries to convince you that they can do a simple calculation and prove everyone else wrong, think about what the same calculation would be in this more straightforward system and see whether the idea holds up. If it does, it might work in the real world (no guarantee though) – but if it doesn’t, then it’s most probably garbage.

[Read more…] about A CERES of fortunate events…

References

  1. P.R. Goode, E. Pallé, A. Shoumko, S. Shoumko, P. Montañes‐Rodriguez, and S.E. Koonin, "Earth's Albedo 1998–2017 as Measured From Earthshine", Geophysical Research Letters, vol. 48, 2021. http://dx.doi.org/10.1029/2021GL094888
  2. N.G. Loeb, G.C. Johnson, T.J. Thorsen, J.M. Lyman, F.G. Rose, and S. Kato, "Satellite and Ocean Data Reveal Marked Increase in Earth’s Heating Rate", Geophysical Research Letters, vol. 48, 2021. http://dx.doi.org/10.1029/2021GL093047
  3. H. Dübal, and F. Vahrenholt, "Radiative Energy Flux Variation from 2001–2020", Atmosphere, vol. 12, pp. 1297, 2021. http://dx.doi.org/10.3390/atmos12101297

Filed Under: Aerosols, Climate Science, Featured Story, Greenhouse gases, Instrumental Record Tagged With: CERES, EEI, energy imblance

  • Page 1
  • Page 2
  • Page 3
  • Page 4
  • Go to Next Page »

Primary Sidebar

Search

Search for:

Email Notification

get new posts sent to you automatically (free)
Loading

Recent Posts

  • The most recent climate status
  • Unforced variations: May 2025
  • Unforced Variations: Apr 2025
  • WMO: Update on 2023/4 Anomalies
  • Andean glaciers have shrunk more than ever before in the entire Holocene
  • Climate change in Africa

Our Books

Book covers
This list of books since 2005 (in reverse chronological order) that we have been involved in, accompanied by the publisher’s official description, and some comments of independent reviewers of the work.
All Books >>

Recent Comments

  • Piotr on Unforced variations: May 2025
  • William on The most recent climate status
  • Mr. Know It All on Unforced variations: May 2025
  • Piotr on The most recent climate status
  • Nigelj on Unforced variations: May 2025
  • Kevin McKinney on Unforced variations: May 2025
  • Kevin McKinney on The most recent climate status
  • Kevin McKinney on The most recent climate status
  • Kevin McKinney on The most recent climate status
  • Mr. Know It All on The most recent climate status
  • K on Unforced variations: May 2025
  • Tomáš Kalisz on Unforced variations: May 2025
  • Tomáš Kalisz on Unforced variations: May 2025
  • Piotr on Unforced variations: May 2025
  • Piotr on Unforced variations: May 2025
  • Susan Anderson on Unforced variations: May 2025
  • Ken Towe on The most recent climate status
  • Keith Woollard on The most recent climate status
  • Dan on Unforced variations: May 2025
  • Nigelj on The most recent climate status

Footer

ABOUT

  • About
  • Translations
  • Privacy Policy
  • Contact Page
  • Login

DATA AND GRAPHICS

  • Data Sources
  • Model-Observation Comparisons
  • Surface temperature graphics
  • Miscellaneous Climate Graphics

INDEX

  • Acronym index
  • Index
  • Archives
  • Contributors

Realclimate Stats

1,365 posts

11 pages

243,163 comments

Copyright © 2025 · RealClimate is a commentary site on climate science by working climate scientists for the interested public and journalists.