Unsurprisingly to anyone looking at the exceptionally warm winter on the West Coast of North America, the Nenana Ice Classic had another near-record early breakup on Friday, netting some lucky winner(s) around $300,000 in prizes.
[Read more…] about Nenana Ice Classic 2015
Reflections on Ringberg
As previewed last weekend, I spent most of last week at a workshop on Climate Sensitivity hosted by the Max Planck Institute at Schloss Ringberg. It was undoubtedly one of the better workshops I’ve attended – it was focussed, deep and with much new information to digest (some feel for the discussion can be seen from the #ringberg15 tweets). I’ll give a brief overview of my impressions below.
Climate Sensitivity Week
 Some of you will be aware that there is a workshop on Climate Sensitivity this week at Schloss Ringberg in southern Germany. The topics to be covered include how sensitivity is defined (and whether it is even meaningful (Spoiler, yes it is)), what it means, how it can be constrained, what the different flavours signify etc. There is an impressive list of attendees with a very diverse range of views on just about everything, and so I am looking forward to very stimulating discussions.
The Soon fallacy
As many will have read, there were a number of press reports (NYT, Guardian, InsideClimate) about the non-disclosure of Willie Soon’s corporate funding (from Southern Company (an energy utility), Koch Industries, etc.) when publishing results in journals that require such disclosures. There are certainly some interesting questions to be asked (by the OIG!) about adherence to the Smithsonian’s ethics policies, and the propriety of Smithsonian managers accepting soft money with non-disclosure clauses attached.
However, a valid question is whether the science that arose from these funds is any good? It’s certainly conceivable that Soon’s work was too radical for standard federal research programs and that these energy companies were really taking a chance on blue-sky high risk research that might have the potential to shake things up. In such a case, someone might be tempted to overlook the ethical lapses and conflicts of interest for the sake of scientific advancement (though far too many similar post-hoc justifications have been used to excuse horrific unethical practices for this to be remotely defendable).
Unfortunately, the evidence from the emails and the work itself completely undermines that argument because the work and the motivation behind it are based on a scientific fallacy.
[Read more…] about The Soon fallacy
Thoughts on 2014 and ongoing temperature trends
Last Friday, NASA GISS and NOAA NCDC had a press conference and jointly announced the end-of-year analysis for the 2014 global surface temperature anomaly which, in both analyses, came out top. As you may have noticed, this got much more press attention than their joint announcement in 2013 (which wasn’t a record year).
In press briefings and interviews I contributed to, I mostly focused on two issues – that 2014 was indeed the warmest year in those records (though by a small amount), and the continuing long-term trends in temperature which, since they are predominantly driven by increases in greenhouse gases, are going to continue and hence produce (on a fairly regular basis) continuing record years. Response to these points has been mainly straightforward, which is good (if sometimes a little surprising), but there have been some interesting issues raised as well…
[Read more…] about Thoughts on 2014 and ongoing temperature trends
Absolute temperatures and relative anomalies
Most of the images showing the transient changes in global mean temperatures (GMT) over the 20th Century and projections out to the 21st C, show temperature anomalies. An anomaly is the change in temperature relative to a baseline which usually the pre-industrial period, or a more recent climatology (1951-1980, or 1980-1999 etc.). With very few exceptions the changes are almost never shown in terms of absolute temperatures. So why is that?
[Read more…] about Absolute temperatures and relative anomalies
On arguing by analogy
Climate blogs and comment threads are full of ‘arguments by analogy’. Depending on what ‘side’ one is on, climate science is either like evolution/heliocentrism/quantum physics/relativity or eugenics/phrenology/Ptolemaic cosmology/phlogiston. Climate contrarians are either like flat-earthers/birthers/moon-landing hoaxers/vaccine-autism linkers or Galileo/stomach ulcer-Helicobacter proponents/Wegener/Copernicus. Episodes of clear misconduct or dysfunction in other spheres of life are closely parsed only to find clubs with which to beat an opponent. Etc. Etc.
While the users of these ‘arguments’ often assume that they are persuasive or illuminating, the only thing that is revealed is how the proposer feels about climate science. If they think it is generally on the right track, the appropriate analogy is some consensus that has been validated many times and the critics are foolish stuck-in-the-muds or corporate disinformers, and if they don’t, the analogy is to a consensus that was overturned and where the critics are the noble paradigm-shifting ‘heretics’. This is far closer to wishful thinking than actual thinking, but it does occasionally signal clearly who is not worth talking to. For instance, an article pretending to serious discussion on climate that starts with a treatise about Lysenkoism in the Soviet Union is not to be taken seriously.
Since the truth or falsity of any scientific claim can only be evaluated on it’s own terms – and not via its association with other ideas or the character of its proponents – this kind of argument is only rhetorical. It gets no-one closer to the truth of any particular matter. The fact is that many, many times, mainstream science has survived multiple challenges by ‘sceptics’, and that sometimes (though not at all often), a broad consensus has been overturned. But knowing which case is which in any particular issue simply by looking for points of analogy with previous issues, but without actually examining the data and theory directly, is impossible. The point being that arguments by analogy are not persuasive to anyone who doesn’t already agree with you on the substance.
Given the rarity of a consensus-overturning event, the only sensible prior is to assume that a consensus is probably valid absent very strong evidence to the contrary, which is incidentally the position adopted by the arch-sceptic Bertrand Russell. The contrary assumption implies there are no a priori reasons to think any scientific body of work is credible which, while consistent, is not one that I have ever found anyone professing in practice. Far more common is a selective rejection of science dependent on other reasons and that is not a coherent philosophical position at all.
Analogies do have their place of course – usually to demonstrate that a supposedly logical point falls down completely when applied to a different (but analogous) case. For instance, an implicit claim that all correct scientific theories are supported by a unanimity of Nobel Prize winners/members of the National Academies, is easily dismissed by reference to Kary Mullis or Peter Duesberg. A claim that CO2 can’t possibly have a significant effect solely because of its small atmospheric mixing ratio, can be refuted as a general claim by reference to other substances (such as arsenic, plutonium or Vitamin C) whose large effects due to small concentrations are well known. Or if a claim is made that all sciences except climate science are devoid of uncertainty, this is refuted by reference to, well, any other scientific field.
To be sure, I am not criticising the use of metaphor in a more general sense. Metaphors that use blankets to explaining how the greenhouse effect works, income and spending in your bank account to stand in for the carbon cycle, what the wobbles in the Earth’s orbit look like if the planet was your head, or conceptualizing the geologic timescale by compressing it to a day, for instance, all serve useful pedagogic roles. The crucial difference is that these mappings don’t come dripping with over-extended value judgements.
Another justification for the kind of analogy I’m objecting to is that it is simply for amusement: “Of course, I’m not really comparing my opponents to child molesters/food adulterers/mass-murderers – why can’t you take a joke?”. However, if you need to point out to someone that a joke (for adults at least) needs to have more substance than just calling someone a poopyhead, it is probably not worth the bother.
It would be nice to have a moratorium on all such analogical arguments, though obviously that is unlikely to happen. The comment thread here can assess this issue directly, but most such arguments on other threads are ruthlessly condemned to the bore-hole (where indeed many of them already co-exist). But perhaps we can put some pressure on users of these fallacies by pointing to this post and then refusing to engage further until someone actually has something substantive to offer. It may be pointless, but we can at least try.
IPCC attribution statements redux: A response to Judith Curry
I have written a number of times about the procedure used to attribute recent climate change (here in 2010, in 2012 (about the AR4 statement), and again in 2013 after AR5 was released). For people who want a summary of what the attribution problem is, how we think about the human contributions and why the IPCC reaches the conclusions it does, read those posts instead of this one.
The bottom line is that multiple studies indicate with very strong confidence that human activity is the dominant component in the warming of the last 50 to 60 years, and that our best estimates are that pretty much all of the rise is anthropogenic.
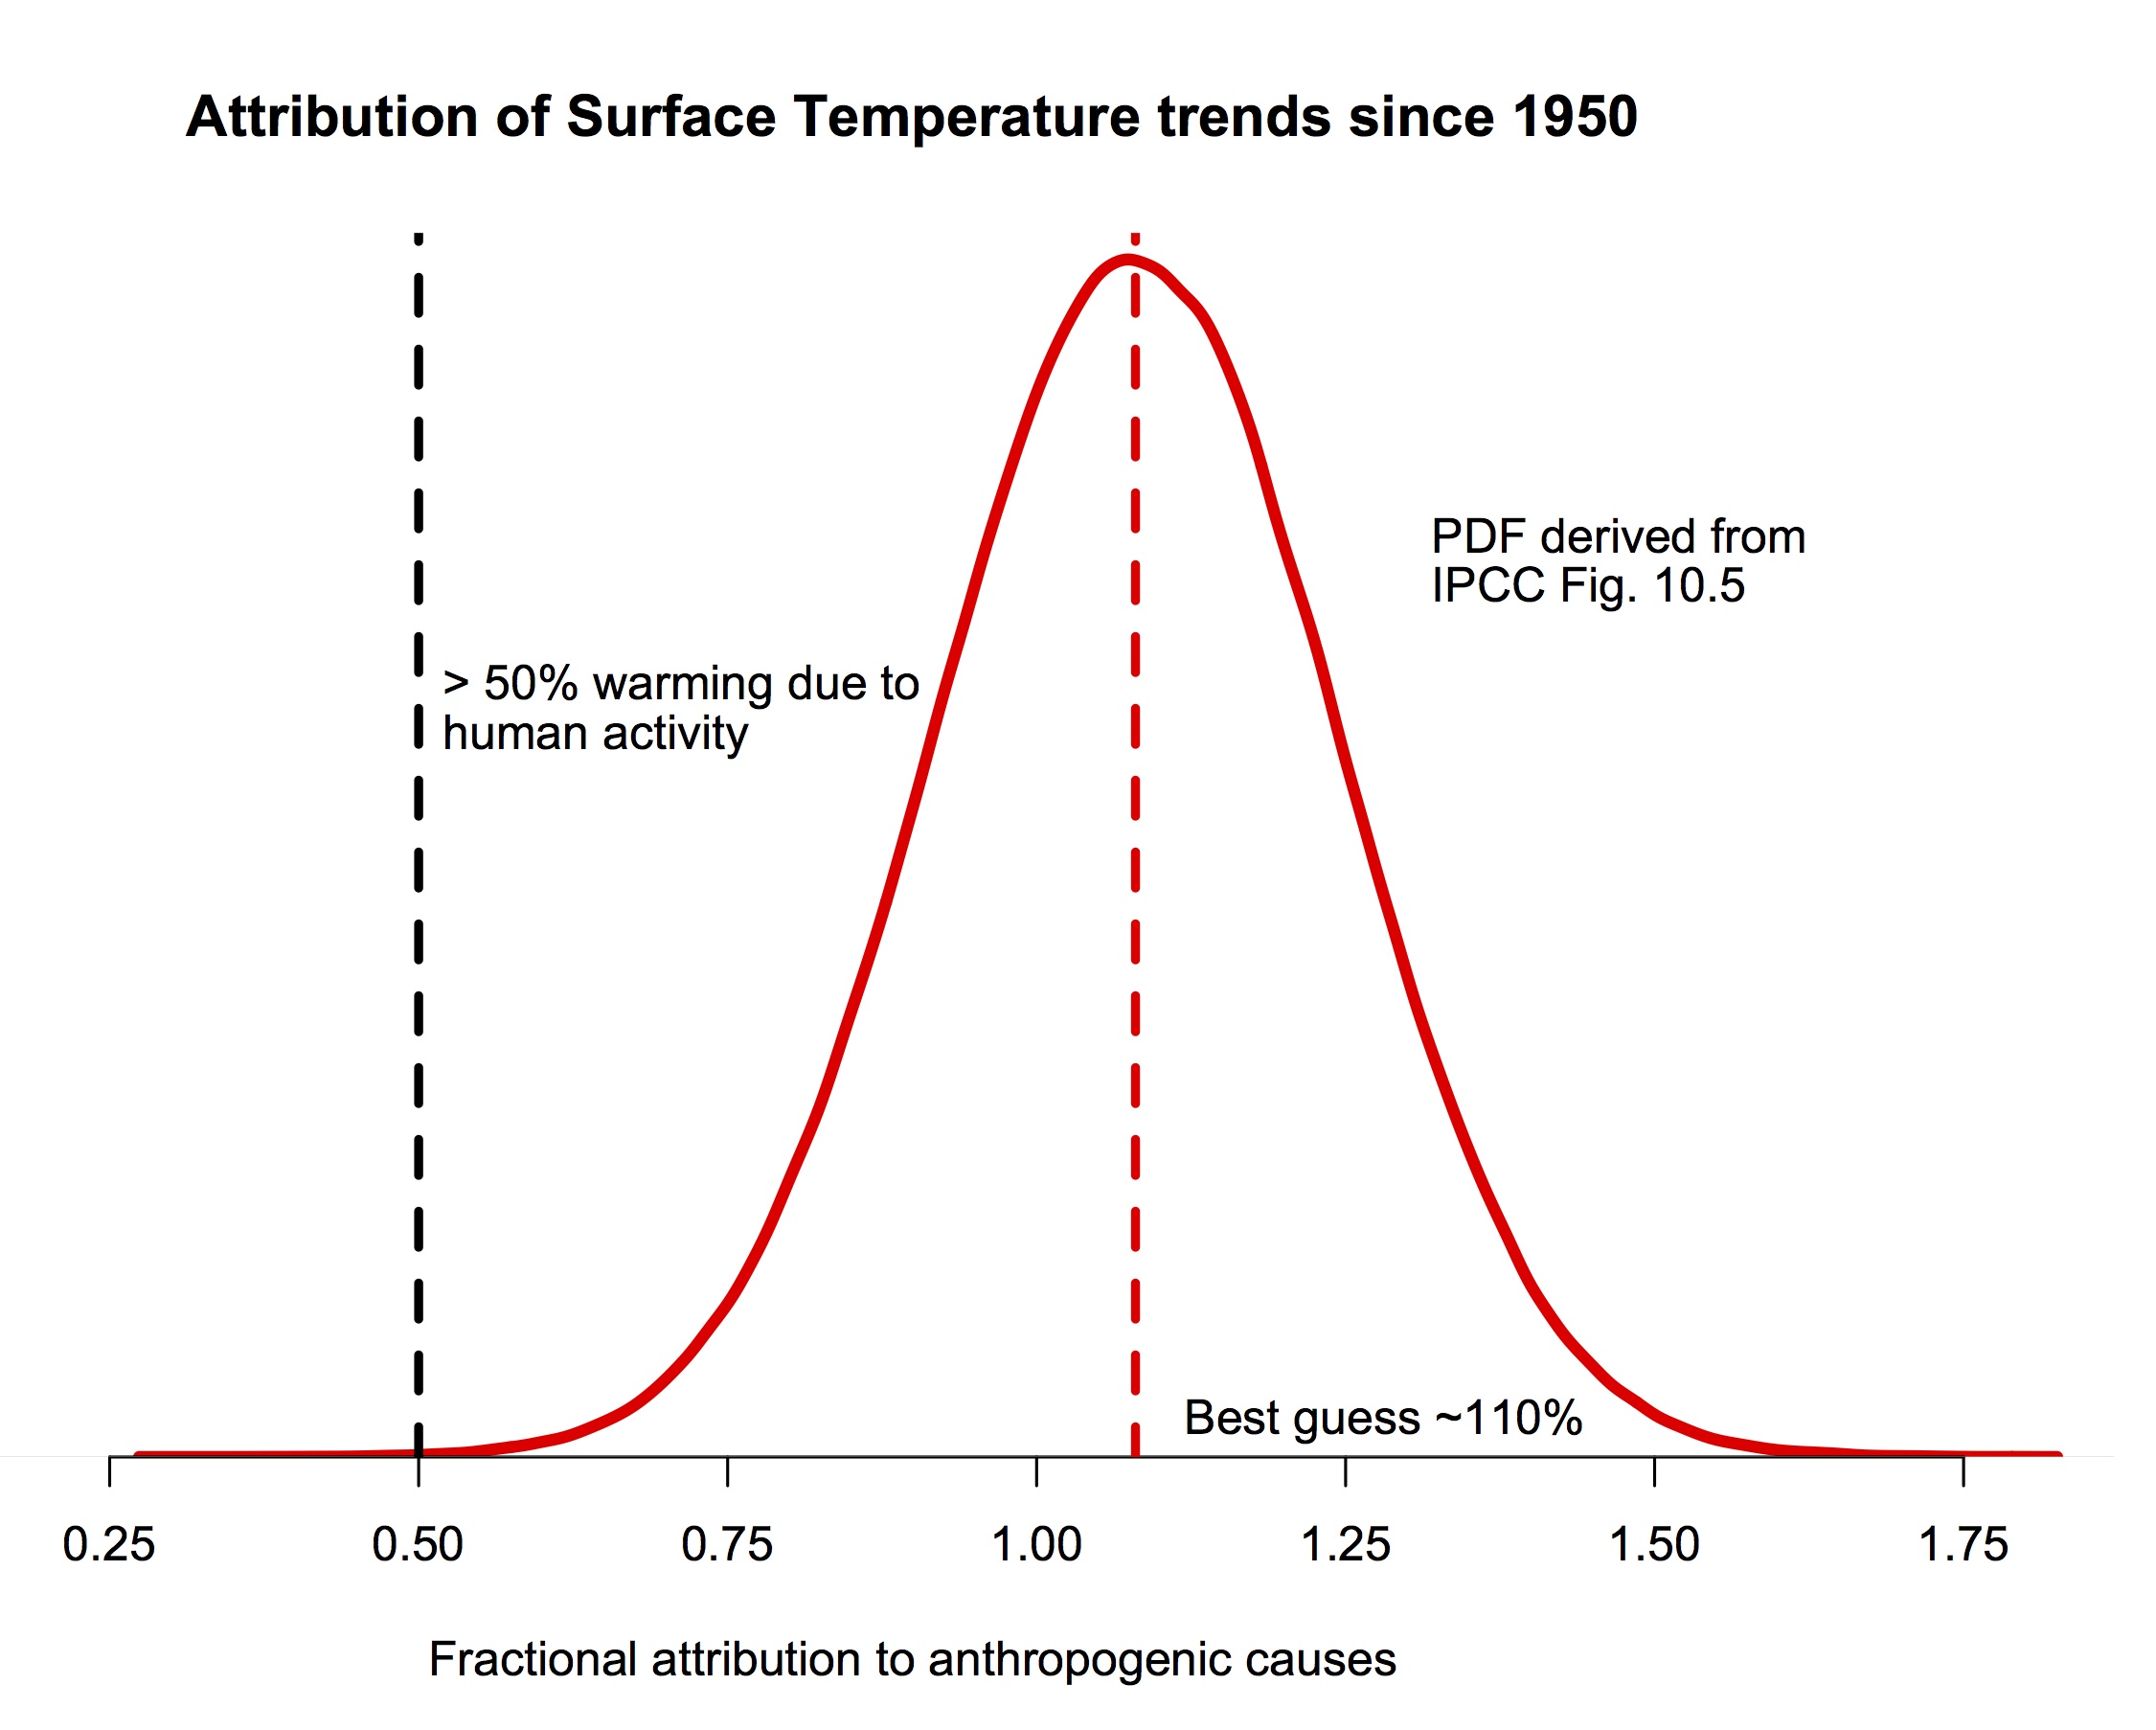
The probability density function for the fraction of warming attributable to human activity (derived from Fig. 10.5 in IPCC AR5). The bulk of the probability is far to the right of the “50%” line, and the peak is around 110%.
If you are still here, I should be clear that this post is focused on a specific claim Judith Curry has recently blogged about supporting a “50-50” attribution (i.e. that trends since the middle of the 20th Century are 50% human-caused, and 50% natural, a position that would center her pdf at 0.5 in the figure above). She also commented about her puzzlement about why other scientists don’t agree with her. Reading over her arguments in detail, I find very little to recommend them, and perhaps the reasoning for this will be interesting for readers. So, here follows a line-by-line commentary on her recent post. Please excuse the length.
[Read more…] about IPCC attribution statements redux: A response to Judith Curry
Faking it
Every so often contrarians post old newspaper quotes with the implication that nothing being talked about now is unprecedented or even unusual. And frankly, there are lots of old articles that get things wrong, are sensationalist or made predictions without a solid basis. And those are just the articles about the economy.
However, there are plenty of science articles that are just interesting, reporting events and explorations in the Arctic and elsewhere that give a fascinating view into how early scientists were coming to an understanding about climate change and processes. In particular, in the Atlantic sector of the Arctic the summer of 1922 was (for the time) quite warm, and there were a number of reports that discussed some unprecedented (again, for the time) observations of open water. The most detailed report was in the Monthly Weather Review:
[Read more…] about Faking it
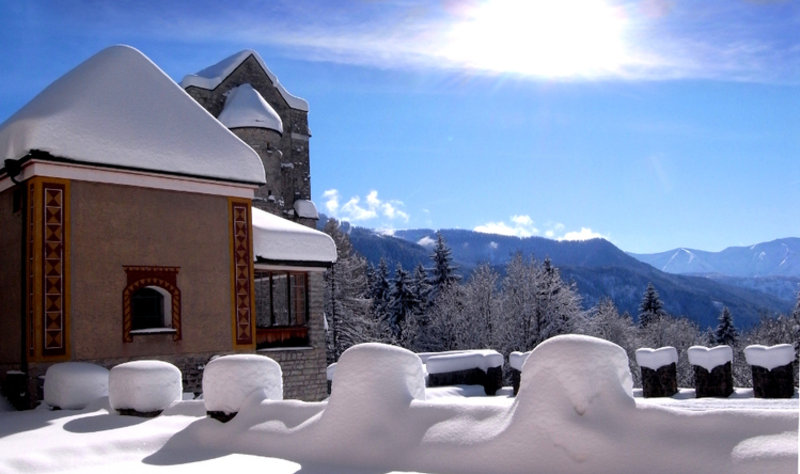
Nenana Ice Classic: Update
Somewhat randomly, my thoughts turned to the Nenana Ice Classic this evening, only to find that the ice break up had only just occurred (3:48 pm Alaskan Standard Time, April 25). This is quite early (the 7th earliest date, regardless of details associated with the vernal equinox or leap year issues), though perhaps unsurprising after the warm Alaskan winter this year (8th warmest on record). This is in strong contrast to the very late break up last year.
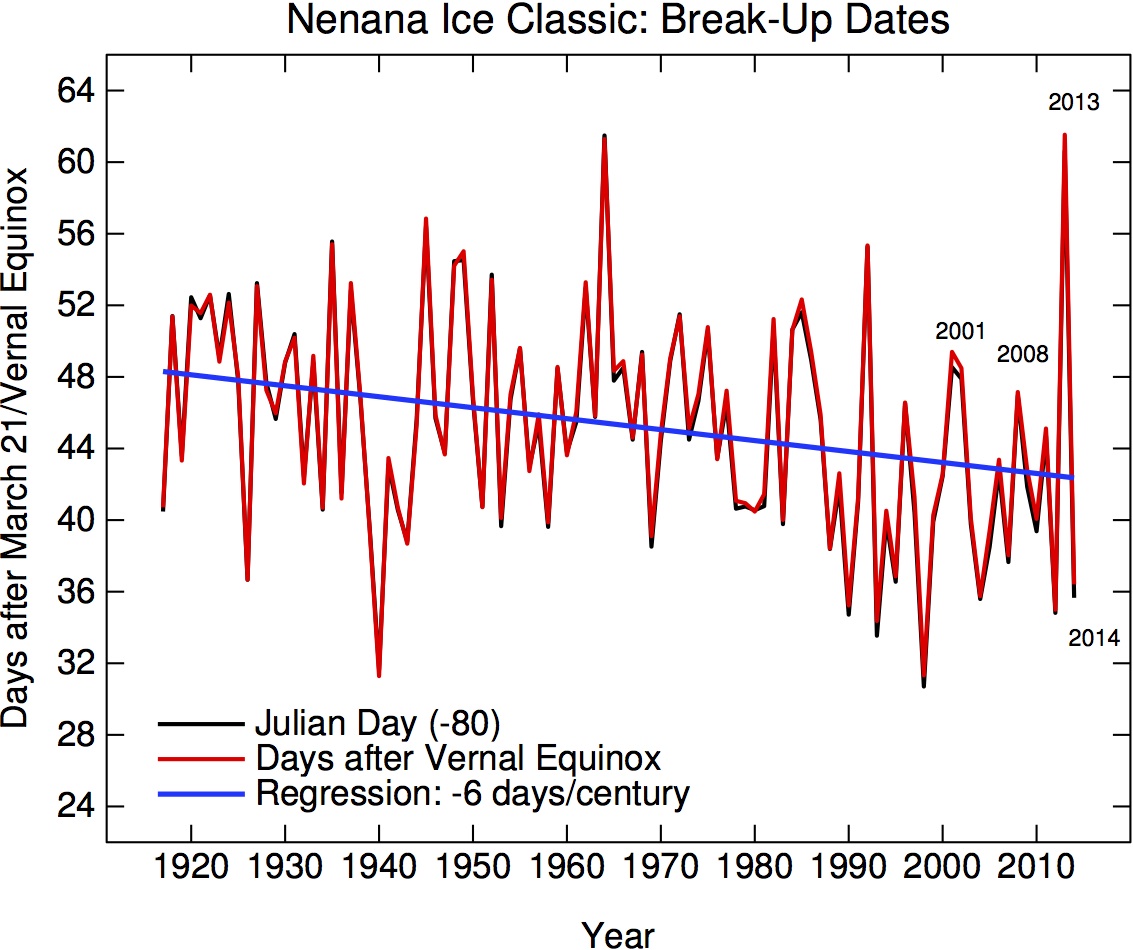
Break up dates accounting for leap years and variations in the vernal equinox.
As mentioned in my recent post, the Nenana break up date is a good indicator of Alaskan regional temperatures and despite last year’s late anomaly, the trends are very much towards a earlier spring. This is also true for trends in temperatures and ice break up mostly everywhere else too, despite individual years (like 2013/2014) being anomalously cold (for instance in the Great Lakes region). As we’ve often stressed, it is the trends that are important for judging climate change, not the individual years. Nonetheless, odds on dates as early as this years have more than doubled over the last century.