Guest commentary by Shaun Lovejoy (McGill University)
Below I summarize the key points of a new Climate Dynamics (CD) paper that I think opens up new perspectives on understanding and estimating the relevant uncertainties. The main message is that the primary sources of error and bias are not those that have been the subject of the most attention – they are not human in origin. The community seems to have done such a good job of handling the “heat island”, “cold park”, and diverse human induced glitches that in the end these make only a minor contribution to the final uncertainty. The reason of course, is the huge amount of averaging that is done to obtain global temperature estimates, this averaging essentially averages out most of the human induced noise.
Two tough sources of uncertainty remain: missing data and a poor definition of the space-time resolution; the latter leads to the key scale reduction factor. In spite of these large low frequency uncertainties, at centennial scales, they are still only about 13% of the IPCC estimated anthropogenic increase (with 90% certainty).
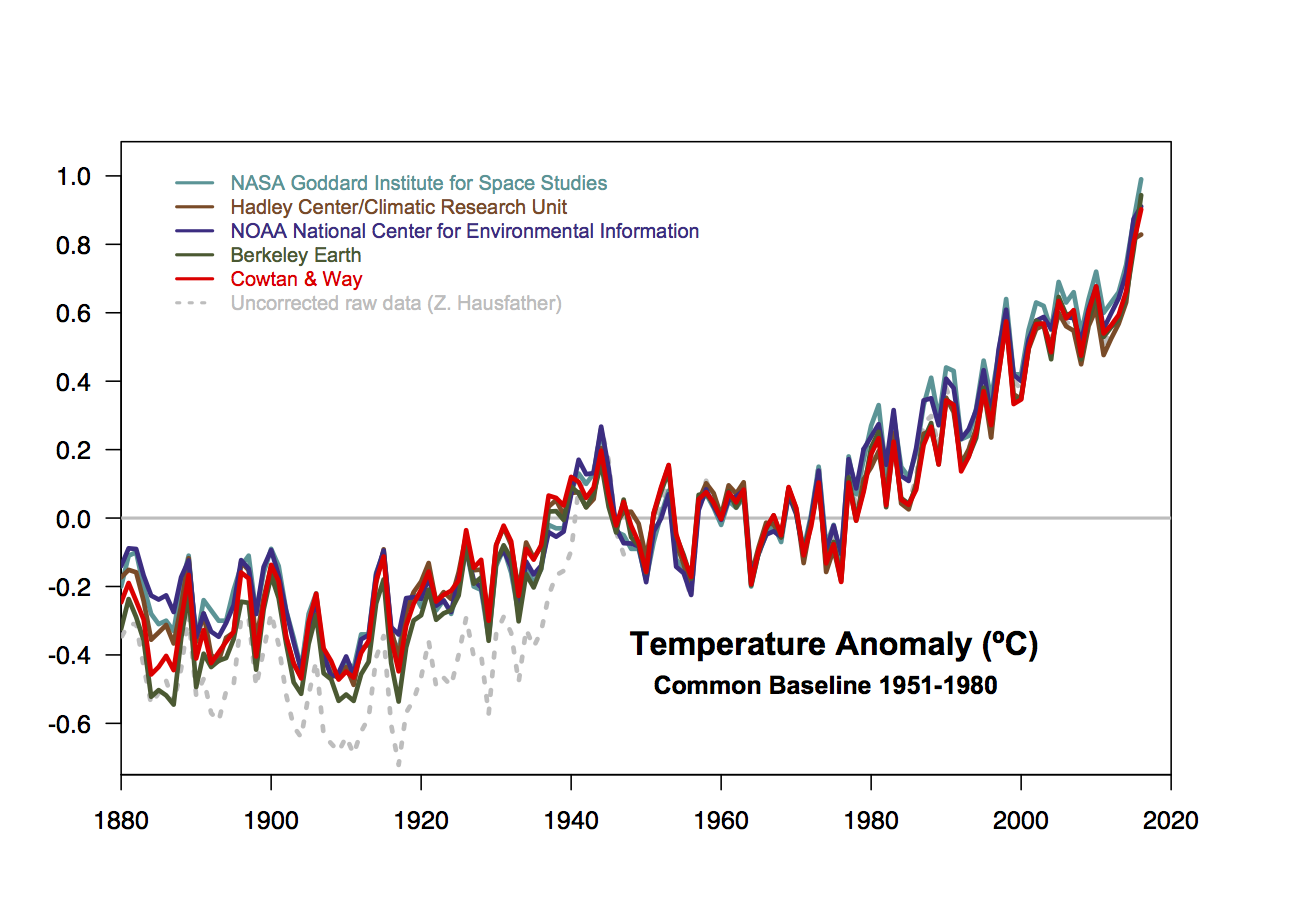
This paper is based on 6 monthly globally averaged temperature series over the common period 1880-2012 using data that were publically available in May 2015. These were NOAA NCEI, NASA GISTEMP, HadCRUT4, Cowtan and Way, Berkeley Earth and the 20th Century Reanalysis. In the first part on relative uncertainties, the series are systematically compared with each other over scales ranging from months to 133 years. In the second part on absolute uncertainties, a stochastic model is developed with two parts. The first simulates the true temperatures, the second treats the measurement errors that would arise from this series from three different sources of uncertainty: i) usual auto-regressive (AR)-type short range errors, ii) missing data, iii) the “scale reduction factor”.
The model parameters are fit by treating each of the six series as a stochastic realization of the stochastic measurement process. This yields an estimate of the uncertainty (spread) of the means of each series about the true temperature – an absolute uncertainty – not simply the spread of the series means about their common mean value (the relative uncertainty). This represents the absolute uncertainty of the series means about a (still unknown) absolute reference point (which is another problem for another post).
[Read more…] about What is the uncertainty in the Earth’s temperature rise?
References
- S. Lovejoy, "How accurately do we know the temperature of the surface of the earth?", Climate Dynamics, vol. 49, pp. 4089-4106, 2017. http://dx.doi.org/10.1007/s00382-017-3561-9