Since 1998 the global temperature has risen more slowly than before. Given the many explanations for colder temperatures discussed in the media and scientific literature (La Niña, heat uptake of the oceans, arctic data gap, etc.) one could jokingly ask why no new ice age is here yet. This fails to recognize, however, that the various ingredients are small and not simply additive. Here is a small overview and attempt to explain how the different pieces of the puzzle fit together.
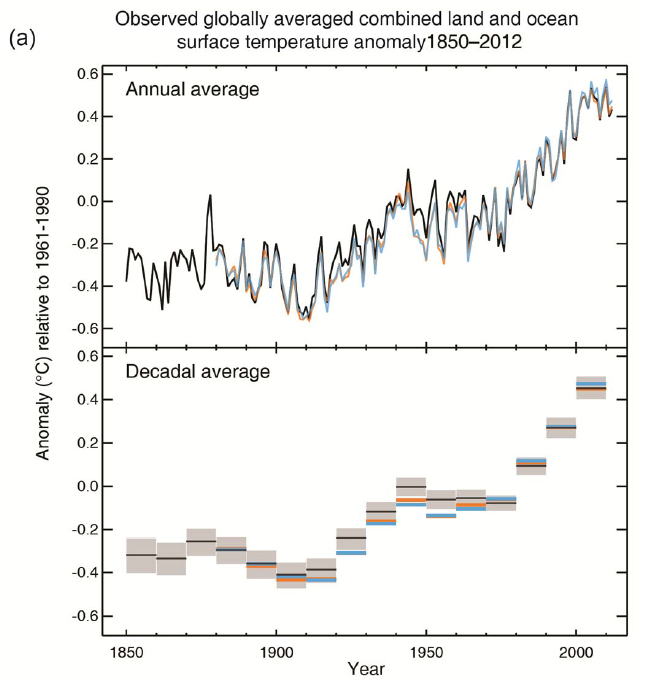
Figure 1 The global near-surface temperatures (annual values at the top, decadal means at the bottom) in the three standard data sets HadCRUT4 (black), NOAA (orange) and NASA GISS (light blue). Graph: IPCC 2013. [Read more…] about The global temperature jigsaw