This month’s open thread. A traditional time to discuss the Arctic sea ice minimum. But NH summer heatwaves, and to be fair, snow in the southern hemisphere, are also fair game…
Blog – realclimate.org – All Posts
Unforced variations: July 2015
This month’s open thread. How about a focus on cimate science this time? Data visualizations anyone?
Heaven belongs to us all – the new papal encyclical
Guest post by Brigitte Knopf
With his encyclical “Laudato Si” the Pope has written more than a moral appeal without obligation. He has presented a pioneering political analysis with great explosive power, which will probably determine the public debate on climate change, poverty and inequality for years to come. Thus, the encyclical is also highly relevant to me as a non-Catholic and non-believer; the implications of the encyclical are very apparent through the eyes of a secular person.
The core of the encyclical makes clear that global warming is a “global problem with grave implications: environmental, social, economic, political and for the distribution of goods” (25 – where the numbers refer to the numbering in the encyclical). The reasons identified are mainly the current models of production and consumption (26). The encyclical emphasizes that the gravest effects of climate change and the increasing inequality are suffered by the poorest (48). Since we face a complex socio-ecological crisis, strategies for a solution demand an integrated approach to combating poverty (139). So far, however, governments have not found a solution for the over-exploitation of the global commons, such as atmosphere, oceans, and forests (169). Therefore, the encyclical focusses on actors, such as non-governmental organizations, cooperatives and intermediate groups (179) and calls for a dialogue between politics, science, business and religion.
The encyclical is, with 246 individual points, too extensive to be discussed in here in its entirety, but three aspects are particularly noteworthy:
- it is based unequivocally onthe scientific consensusthat global warmingis taking placeand that climate changeis man-made; itrejects thedenialof anthropogenicwarming;
- it unmasks the political and economic structures of power behind the climate change debate and stresses the importance of non-state actors in achieving change; and
- it defines the atmosphere and the environment as a common good rather than a “no man’s land”, available for anyone to pollute. This underlines that climate change is strongly related to the issues of justice and property rights.
[Read more…] about Heaven belongs to us all – the new papal encyclical
Debate in the noise
Last week there was an international media debate on climate data which appeared to be rather surreal to me. It was claimed that the global temperature data had so far shown a “hiatus” of global warming from 1998-2012, which was now suddenly gone after a data correction. So what happened?
One of the data centers that compile the data on global surface temperatures – NOAA – reported in the journal Science on an update of their data. Some artifacts due to changed measurement methods (especially for sea surface temperatures) were corrected and additional data of previously not included weather stations were added. All data centers are continually working to improve their database and they therefore occasionally present version updates of their global series (NASA data are currently at version 3, the British Hadley Centre data at version 4). There is nothing unusual about this, and the corrections are in the range of a few hundredths of a degree – see Figure 1. This really is just about fine details. [Read more…] about Debate in the noise
NOAA temperature record updates and the ‘hiatus’
In a new paper in Science Express, Karl et al. describe the impacts of two significant updates to the NOAA NCEI (née NCDC) global temperature series. The two updates are: 1) the adoption of ERSST v4 for the ocean temperatures (incorporating a number of corrections for biases for different methods), and 2) the use of the larger International Surface Temperature Initiative (ISTI) weather station database, instead of GHCN. This kind of update happens all the time as datasets expand through data-recovery efforts and increasing digitization, and as biases in the raw measurements are better understood. However, this update is going to be bigger news than normal because of the claim that the ‘hiatus’ is no more. To understand why this is perhaps less dramatic than it might seem, it’s worth stepping back to see a little context…
[Read more…] about NOAA temperature record updates and the ‘hiatus’
References
- T.R. Karl, A. Arguez, B. Huang, J.H. Lawrimore, J.R. McMahon, M.J. Menne, T.C. Peterson, R.S. Vose, and H. Zhang, "Possible artifacts of data biases in the recent global surface warming hiatus", Science, vol. 348, pp. 1469-1472, 2015. http://dx.doi.org/10.1126/science.aaa5632
- B. Huang, V.F. Banzon, E. Freeman, J. Lawrimore, W. Liu, T.C. Peterson, T.M. Smith, P.W. Thorne, S.D. Woodruff, and H. Zhang, "Extended Reconstructed Sea Surface Temperature Version 4 (ERSST.v4). Part I: Upgrades and Intercomparisons", Journal of Climate, vol. 28, pp. 911-930, 2015. http://dx.doi.org/10.1175/JCLI-D-14-00006.1
Unforced Variations: June 2015
This month’s open thread. Some interesting trends in ocean heat content, surface temperatures, multiple oddly reported papers (which are often linked to ambiguous press releases…) etc. But at least we aren’t working in political science…
Global warming and unforced variability: Clarifications on recent Duke study
Guest Commentary from Patrick Brown and Wenhong Li, Duke University
We recently published a study in Scientific Reports titled Comparing the model-simulated global warming signal to observations using empirical estimates of unforced noise. Our study seemed to generated a lot of interest and we have received many inquires regarding its findings. We were pleased with some of coverage of our study (e.g., here) but we were disappointed that some outlets published particularly misleading articles (e.g, here, here, and here). Since there appears to be some confusion regarding our study’s findings, we would like to clarify some points (see also MM4A’s discussion).
[Read more…] about Global warming and unforced variability: Clarifications on recent Duke study
References
- P.T. Brown, W. Li, E.C. Cordero, and S.A. Mauget, "Comparing the model-simulated global warming signal to observations using empirical estimates of unforced noise", Scientific Reports, vol. 5, 2015. http://dx.doi.org/10.1038/srep09957
Unforced Variations: May 2015
How long does it take Antarctica to notice the Northern Hemisphere is warming?
Eric Steig
A series of large and abrupt climate changes occurred during the last ice age, most clearly expressed in ice cores from Greenland and other paleoclimate data from the circum-North-Atlantic region. Since the discovery of these events, we’ve been trying to pin down the timing of abrupt climate changes elsewhere on the globe. Were there corresponding events in the Southern Hemisphere? And did they occur at the same time? A new paper published this week in Nature (April 30th, 2015) provide a significantly updated answer to these questions. Many in the climate research community — both modern climate and paleoclimate — will find the results quite interesting.
The new paper is the culmination of a huge effort to develop the best-dated long ice core record from Antarctica, rivaling the GISP2 and GRIP ice cores obtained from central Greenland in the early 1990s, and the more recent NGRIP and NEEM cores from North Greenland (e.g. NEEM Community Members, 2014). The core was obtained at the West Antarctic Ice Sheet divide (WAIS Divide), led by the Desert Research Institute and the University of Nevada, with the University of New Hampshire. The new paper was written by a consortium of postdocs, faculty, and students at the Oregon State University and University of Washington: Christo Buizert, myself, and Joel Pedro (now at University of Copenhagen), with Brad Markle, Ed Brook, Jeff Severinghaus and Ken Taylor. We have more than 70 other co-authors — faculty colleagues, students, postdocs, logistics coordinators, and ice-drillers — who all made substantial contributions as well. These deep ice cores are a lot of work!
We published records from the WAIS Divide ice core in 2013, covering the last two millennia and the last 30 thousand years (Steig et al., 2013, WAIS Divide Project Members, 2013). Our new work, WAIS Divide Project Members, 2015, extends the record to the bottom of the core (nearly the bottom of the ice sheet at 3400 m depth), and an age of 68 thousand years. Details on the timescale for the core are given in the open-access paper in Climate of the Past (Buizert et al., 2015). The new paper in Nature provides a comparison of the timing of changes in Antarctic temperature with the timing of the abrupt warming and cooling events that characterize the Greenland ice core records. Note that the comparison is actually made between the records of oxygen isotope ratios (δ18O), but we have very strong evidence that these track temperature quite faithfully on the relevant timescales, so I’ll use “temperature” here for simplicity.
The abrupt events in Greenland, characterized by rapid transitions from cold “stadial” to warm “interstadial” conditions and back, and commonly known as Dansgaard-Oeschger (D-O) events, were felt across the Northern Hemisphere almost immediately, as far as we can tell. But the impact of D-O events in Antarctica has been ambiguous. We’ve known for some time that temperatures in Antarctica change more slowly, and with much smaller amplitude, than in the Northern Hemisphere. In general, the Antarctic temperatures begin to decline when Greenland warms abruptly, and to increase when Greenland cools abruptly (Blunier et al., 1998). This relationship is often called the “bipolar seesaw” and is commonly attributed to the redistribution of heat between the Northern and Southern Hemispheres via changes in the Atlantic meridional overturning circulation (AMOC). We’ve also been pretty sure that each of the D-O interstadials has a corresponding warm peak in Antarctica, referred to as the “Antarctic Isotope Maximum” (AIM) events (EPICA Community Members, 2006, and Stefan Rahmstorf’s write-up in an earlier RealClimate post). But the exact phase relationship has been unknown, making it problematic to validate model simulations with confidence (see e.g. Roe and Steig, 2004, Steig, 2006).
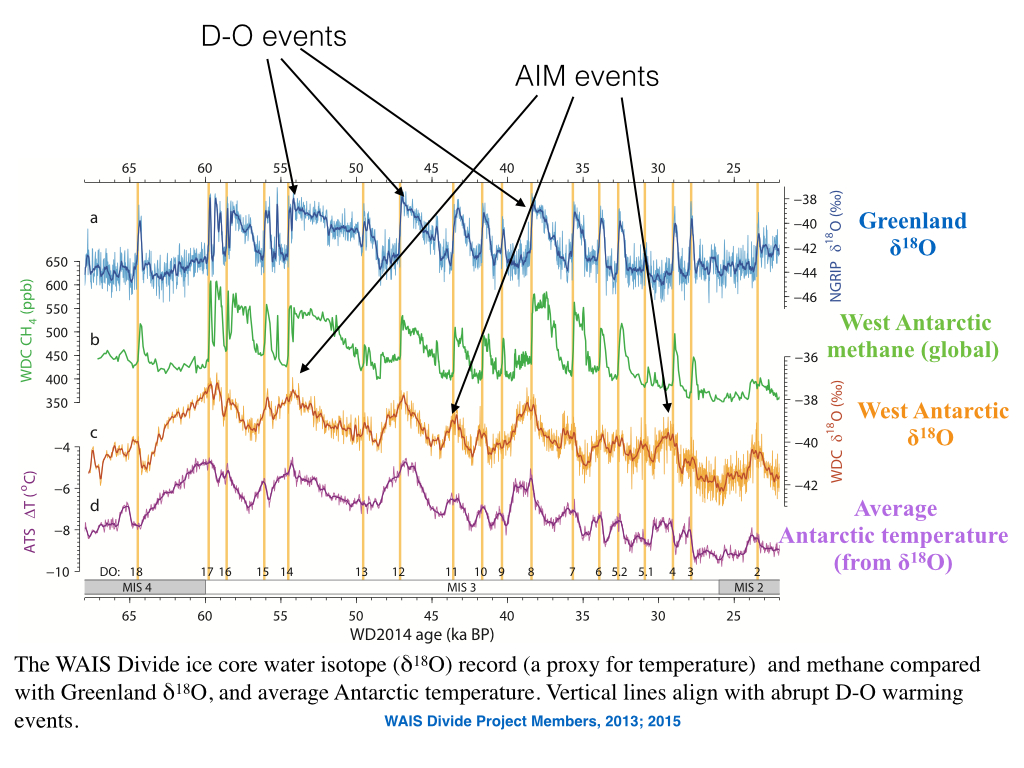
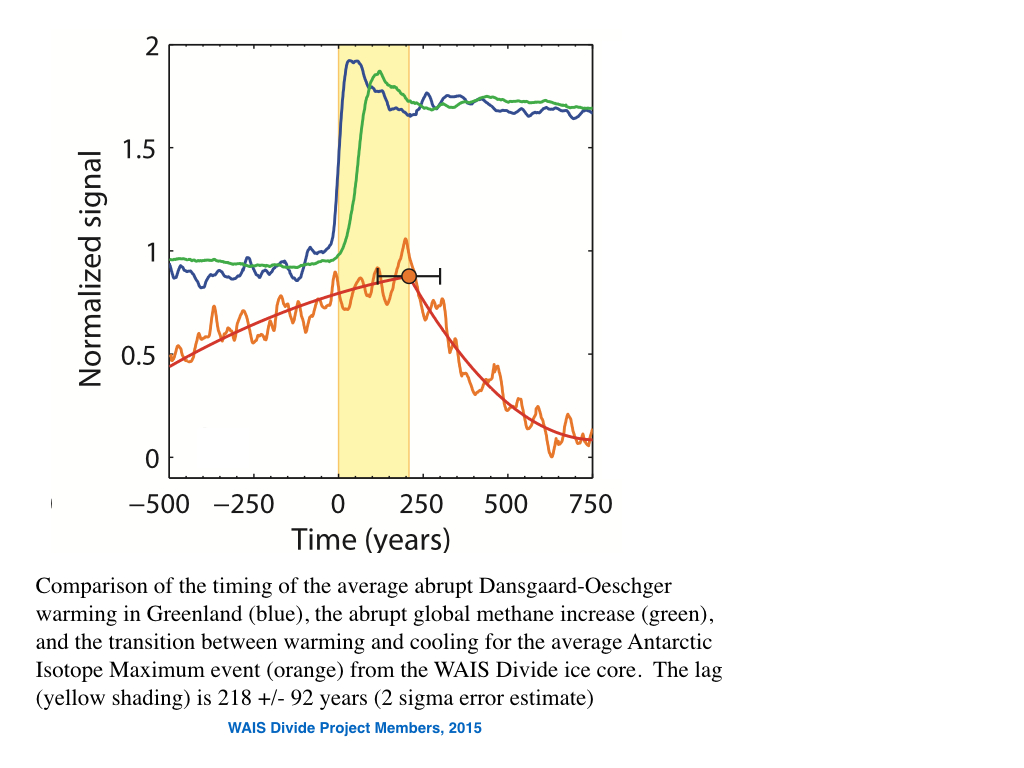
The first paper to really start to pin down the phase relationship was that of Pedro et al., 2011, who showed that the most recent of the major abrupt events in Greenland cores (the Bølling warming about 14,700 years ago and the Younger Dryas cooling about 12,880 years ago), the direction of Antarctic temperatures changed at almost exactly the same time. (Note that the Antarctic temperatures don’t change abruptly — their slow trends simply reverse sign, as shown in the figure). But the uncertainties estimated by Pedro et al. were about 200 years on either side of zero. That’s impressively good precision for something that happened more than 10,000 years ago, but not quite good enough. Our new work firms up these numbers a lot, and shows that Antarctic temperatures did not really change at the same time as the abrupt events in Greenland. Instead, when an abrupt D-O warming occurs in Greenland, it takes about 200 years until the concomitant cooling begins in Antarctica. Similarly, when an abrupt cooling occurs in Greenland, it takes about 200 years until Antarctic starts warming up. Our uncertainties are much smaller, +/-95 years*, and it is very unlikely that our numbers overlap with zero. Antarctica, in other words, almost certainly takes a century or two to notice what is happening in the Greenland.
The 200-year timescale is fascinating, because it is longer than suggested by a number of modeling studies, such as the simple “bipolar seesaw” model of Stocker and Johnson, 2003, as well as the fully-coupled transient run of a general circulation model by He et al., 2013: both show an essentially instantaneous response between the Northern Hemisphere and the Antarctic. Yet it’s also shorter than implied by many discussions of the relationship; for example, we (Steig and Alley, 2002) made the case for a 400-year lag between Greenland Antarctica, which Schmittner et al., 2003 reproduced in a climate model in which the AMOC is perturbed.
So what does the intermediate timescale of ~200 years tell us? It’s important to recognize that there are reasons why one might expect either a “fast” propagation or a “slow” propagation of the Greenland climate signal to the Antarctic. The very large sea ice changes in the North Atlantic associated with D-O events would have an impact on the atmosphere, and this should propagate global signals almost instantaneously. Indeed, this must have occurred, or we wouldn’t have the evidence that we do for abrupt changes in places as far flung as China, India, or the tropical Pacific that are in phase with Greenland temperature change. Methane variations, which are probably of tropical origin, are in phase with Greenland temperature within about 20 years (e.g., Rosen et al., 2014).
The ocean itself can propagate signals very fast, via adjustment of the upper ocean by fast Kelvin waves propagating along the ocean boundaries (e.g. Johnson and Marshall, 2002). For example, Schmittner et al. (2003), and Rind et al. (2001) both found that the North Atlantic signal in their models propagates to the South Atlantic region very quickly, appearing in subsurface waters with a time lag of only about a few decades. However, they also find a century or multi-century delay in the further southward propagation from the South Atlantic to the Antarctic across the Antarctic Circumpolar Current (ACC). Furthermore, the propagation time varies with the strength of the ACC as imposed in the model.
There are, in short, multiple parts of the ocean and atmosphere system involved, and these have different timescales. It appears that our results are right about where the physics suggests they should be. A key factor in capturing this physics properly in models seems to be how (or how well) the ACC is simulated. That’s interesting, and highly relevant to modern climate studies. How the ACC is changing now, or may change in the future, is a topic of significant interest (Fyfe and Saeko, 2005; Böning et al., 2008). And the question of how long it will take the Antarctic to catch up with the rest of the globe is of critical importance to long term projections of the response of the ice sheet to climate change — and hence the response of sea level. The D-O events and the current anthropogenic global warming are of course very different beasts, but the long timescales indicated by our results are certainly in keeping with climate model projections of the future, showing that most of Antarctic should lag the rest of the planet (recent rapid warming on the Antarctic Peninsula and West Antarctica not withstanding).
Note that our results should not be taken as demonstrating anything very specific in terms of the cause of Dansgaard-O events. To be sure, the results demonstrate a clear north-to-south direction in the propagation of the climate signal associated with abrupt D-O warming and cooling events. But that doesn’t tell us what the driving “trigger” is. To use an analogy suggested by co-author Severinghaus, suppose we didn’t know anything about the physics relating lightning to thunder. Careful measurements of their relative timing would reveal that thunder always occurs very soon (or immediately) after lightning. But hearing thunder gives you only a general prediction of when the next lightning will be observed. One would correctly deduce that lightning causes thunder. That’s progress. But it would not tell you the cause of the lightning in the first place.
For my part, I’ve long been a skeptic about the old idea that the D-O variations are ultimately driven by meltwater and/or iceberg fluxes into the North Atlantic (the Day after Tomorrow scenario, if you will). There are only 6 clearly-identified Heinrich events (that is, layers of terrestrial sediment in ocean sediment cores from the North Atlantic, evidence for massive iceberg discharges from the Laurentide ice sheet) but there are at least 23 D-O events. It more likely that there is intrinsic variability in the coupled ocean-atmosphere system, as found for example in a long simulation with the climate model CCSM4 by Peltier and Vettoretti (2014 and 2015) (though there is debate about the validity of the very low values for ocean vertical mixing used in those simulations). Iceberg discharges are then just the consequence, not the cause, of changes in ocean circulation, as argued recently by Alvarez Solaz et al. (2013) and also suggested by Barker et al. (2015) who found that on average, evidence for icebergs in the North Atlantic follow, rather than precede, the abrupt coolings at the end of some D-O events. That doesn’t mean that the huge ice and meltwater fluxes associated with Heinrich events don’t have an impact; most modeling work suggests that they would. But it may be important in this context that our results show no dependence of the ~200-year lag on whether or not a Heinrich event has occurred: that is, there is no evidence that “Heinrich stadials” (the cold periods during which Heinrich events occur) are unusual with respect to ocean “seesaw” dynamics. The role of these events in millennial scale variability therefore remains an important, and open, research question (see e.g., Margari et al., 2010).
In the meantime our precise observations of the phasing of D-O and AIM events provide an important new constraint against which to validate model simulations designed to capture the dynamics of these interesting features of the climate system.
UPDATE: The News & Views article about our article, by Tas van Ommen is worth a read. Available here (subscription based only, I’m afraid).
Notes. *The ability to obtain such small uncertainties is owing to four main things. First, we have very high resolution measurements of methane in both the WAIS Divide and the Greenland cores; methane is globally well mixed, and so abrupt changes in methane must happen at the same time (within a year) in cores from both regions. This means that we can synchronize the age of the gas trapped in the bubbles within the cores very precisely. Second, we have very high resolution measurements of the nitrogen isotope ratio (15N/14N in atmospheric N2), also trapped in the bubbles in the cores. This isotope ratio provides information on the age difference between the gas and the ice, because gravitational settling increases the 15N/14N ratio; this depends on the thickness of the firn (the permeable ice between the surface and the impermeable ice at depth where bubbles are trapped). The deeper the firn, the longer it takes to trap gases, and the larger the age difference. It’s the age of the ice that we’re actually interested in, because this, not the gas trapped within the ice, is what the δ18O measurements are made on. Fourth, this age difference is much smaller at WAIS Divide than in any other long Antarctic record; it is at most ~500 years, compared with e.g., ~4000 years at Vostok. Finally, we also have unprecedentedly high resolution measurements of δ18O, and very high quality borehole temperature measurements, which together provide a very robust measure of the temperature variations through time.
Data: The data from the paper are all available in the Supplement to the paper. The timescale and the oxygen isotope data from our lab — what most people will be interested in — are available at the National Snow and Ice Data Center, at doi:10.7265/N5GT5K41.
References:
Barker, S., J. Chen, X. Gong, L. Jonkers, G. Knorr, D. Thornalley. Icebergs not the trigger for North Atlantic cold events. Nature 520, 333–336, 2015. http://dx.doi.org/10.1038/nature14330.
Blunier, T., J. Chappellaz, J. Schwander, A. Dällenbach, B. Stauffer, T.F. Stocker, D. Raynaud, J. Jouzel, H.B. Clausen, C.U. Hammer, and S.J. Johnsen, “”, Nature, vol. 394, pp. 739-743, 1998. http://dx.doi.org/10.1038/29447.
Böning, C.W., A. Dispert, M. Visbeck, S. R. Rintoul, F. U. Schwarzkop. The response of the Antarctic Circumpolar Current to recent climate change. Nature Geoscience 1, 864-869 (2008).
http://dx.doi.org/10.1038/ngeo362.
Buizert, C., Cuffey, K. M., Severinghaus, J. P., Baggenstos, D., Fudge, T. J., Steig, E. J., Markle, B. R., Winstrup, M., Rhodes, R. H., Brook, E. J., Sowers, T. A., Clow, G. D., Cheng, H., Edwards, R. L., Sigl, M., McConnell, J. R., and Taylor, K. C.: The WAIS Divide deep ice core WD2014 chronology – Part 1: Methane synchronization (68–31 ka BP) and the gas age–ice age difference, Clim. Past, 11, 153-173, 2015. http://dx.doi.org/10.5194/cp-11-153-2015.
EPICA Community Members, “One-to-one coupling of glacial climate variability in Greenland and Antarctica”, Nature, vol. 444, pp. 195-198, 2006. http://dx.doi.org/10.1038/nature05301
Fyfe, J.C. and O. A. Saenko, 2005: Human-Induced Change in the Antarctic Circumpolar Current. J. Climate, 18, 3068–3073. http://dx.doi.org/10.1175/JCLI3447.1
Grootes, P.M., M. Stuiver, J.W.C. White, S. Johnsen, and J. Jouzel, “Comparison of oxygen isotope records from the GISP2 and GRIP Greenland ice cores”, Nature, vol. 366, pp. 552-554, 1993. http://dx.doi.org/10.1038/366552a0.
He, F., J.D. Shakun, P.U. Clark, A.E. Carlson, Z. Liu, B.L. Otto-Bliesner, and J.E. Kutzbach, “Northern Hemisphere forcing of Southern Hemisphere climate during the last deglaciation”, Nature, vol. 494, pp. 81-85, 2013. http://dx.doi.org/10.1038/nature11822.
Margari, V., L.C. Skinner, P.C. Tzedakis, A. Ganopolski, M. Vautravers, N.J. Shackleton. The nature of millennial-scale climate variability during the past two glacial periods. Nature Geoscience 3, 127 – 131 (2010) http://dx.doi.org/10.1038/ngeo740.
NEEM Community Members, Eemian interglacial reconstructed from a Greenland folded ice core, Nature, vol. 493, pp. 489-494, 2013. http://dx.doi.org/10.1038/nature11789.
Pedro, J.B., T.D. van Ommen, S.O. Rasmussen, V.I. Morgan, J. Chappellaz, A.D. Moy, V. Masson-Delmotte, and M. Delmotte, The last deglaciation: timing the bipolar seesaw, Climate of the Past, vol. 7, pp. 671-683, 2011. http://dx.doi.org/10.5194/cp-7-671-2011.
Peltier, W. R., and G. Vettoretti, Dansgaard-Oeschger oscillations predicted in a comprehensive model of glacial climate: A “kicked” salt oscillator in the Atlantic, Geophys. Res. Lett.,41, 7306–7313, 2014. http://dx.doi.org/10.1002/2014GL061413.
Rind, D., G. Russell, G. Schmidt, S. Sheth, D. Collins, P. deMemocal, J. Teller. Effects of glacial meltwater in the GISS coupled atmosphere–ocean model, 2. A bipolar seesaw in Atlantic Deep Water production. Journal Geophysical Research, 106, pp. 27,355–27,365, 2001. http://dx.doi.org/10.1029/2001JD000954
Roe, G.H. and E.J. Steig. Characterization of Millennial-Scale Climate Variability. J. Climate, 17, 1929–1944. http://journals.ametsoc.org/doi/full/10.1175/1520-0442%282004%29017%3C1929%3ACOMCV%3E2.0.CO%3B2.
Rosen, J.L., E.J. Brook, J.P. Severinghaus, T. Blunier, L.E. Mitchell, J.E. Lee, J.S. Edwards, and V. Gkinis, An ice core record of near-synchronous global climate changes at the Bølling transition, Nature Geosci, vol. 7, pp. 459-463, 2014. http://dx.doi.org/10.1038/ngeo2147.
Schmittner, A., O. Saenko, and A. Weaver, Coupling of the hemispheres in observations and simulations of glacial climate change, Quaternary Science Reviews, vol. 22, pp. 659-671, 2003. http://dx.doi.org/10.1016/S0277-3791(02)00184-1.
Steig, E.J. et al., Q. Ding, J.W.C. White, M. Küttel, S.B. Rupper, T.A. Neumann, P.D. Neff, A.J.E. Gallant, P.A. Mayewski, K.C. Taylor, G. Hoffmann, D.A. Dixon, S.W. Schoenemann, B.R. Markle, T.J. Fudge, D.P. Schneider, A.J. Schauer, R.P. Teel, B.H. Vaughn, L. Burgener, J. Williams, and E. Korotkikh, “Recent climate and ice-sheet changes in West Antarctica compared with the past 2,000 years”, Nature Geosci, vol. 6, pp. 372-375, 2013. http://dx.doi.org/10.1038/NGEO1778.
Steig, E.J., Climate change: The south–north connection, Nature, vol. 444, pp. 152-153, 2006. http://dx.doi.org/10.1038/444152a
Stocker, T.F. and S.J. Johnsen, A minimum thermodynamic model for the bipolar seesaw, Paleoceanography, vol. 18, pp. n/a-n/a, 2003. http://dx.doi.org/10.1029/2003PA000920.
Vettoretti, G. and W.R. Peltier (2015), Interhemispheric air temperature phase relationships in the nonlinear Dansgaard-Oeschger oscillation. Geophys. Res. Lett., 42: 1180–1189. http://dx.doi.org/10.1002/2014GL062898.
WAIS Divide Project Members. Onset of deglacial warming in West Antarctica driven by local orbital forcing. Nature, 500: 440-444, 2013. http://dx.doi.org/10.1038/nature12376.
WAIS Divide Project Members. Precise interpolar phasing of abrupt climate change during the last ice age. Nature http://dx.doi.org/10.1038/nature14401.
Nenana Ice Classic 2015
Unsurprisingly to anyone looking at the exceptionally warm winter on the West Coast of North America, the Nenana Ice Classic had another near-record early breakup on Friday, netting some lucky winner(s) around $300,000 in prizes.
[Read more…] about Nenana Ice Classic 2015