• Skip to primary navigation
  • Skip to main content
  • Skip to primary sidebar
  • Skip to footer

RealClimate

Climate science from climate scientists...

  • Start here
  • Model-Observation Comparisons
  • Miscellaneous Climate Graphics
  • Surface temperature graphics
You are here: Home / Archives for Climate Science / Climate modelling

Climate modelling

Judy Curry’s attribution non-argument

18 Apr 2017 by Gavin

Following on from the ‘interesting’ House Science Committee hearing two weeks ago, there was an excellent rebuttal curated by ClimateFeedback of the unsupported and often-times misleading claims from the majority witnesses. In response, Judy Curry has (yet again) declared herself unconvinced by the evidence for a dominant role for human forcing of recent climate changes. And as before she fails to give any quantitative argument to support her contention that human drivers are not the dominant cause of recent trends.

Her reasoning consists of a small number of plausible sounding, but ultimately unconvincing issues that are nonetheless worth diving into. She summarizes her claims in the following comment:

… They use models that are tuned to the period of interest, which should disqualify them from be used in attribution study for the same period (circular reasoning, and all that). The attribution studies fail to account for the large multi-decadal (and longer) oscillations in the ocean, which have been estimated to account for 20% to 40% to 50% to 100% of the recent warming. The models fail to account for solar indirect effects that have been hypothesized to be important. And finally, the CMIP5 climate models used values of aerosol forcing that are now thought to be far too large.

These claims are either wrong or simply don’t have the implications she claims. Let’s go through them one more time.

[Read more…] about Judy Curry’s attribution non-argument

Filed Under: Climate modelling, Climate Science, Greenhouse gases

Model projections and observations comparison page

11 Apr 2017 by Gavin

We should have done this ages ago, but better late than never!

We have set up a permanent page to host all of the model projection-observation comparisons that we have monitored over the years. This includes comparisons to early predictions for global mean surface temperature from the 1980’s as well as more complete projections from the CMIP3 and CMIP5. The aim is to maintain this annually, or more often if new datasets or versions become relevant.

We are also happy to get advice on stylistic choices or variations that might make the graphs easier to comprehend or be more accurate – feel free to suggest them in the comments below (since the page itself will be updated over time, it doesn’t have comments associated with it).

If there are additional comparisons you are aware of that you think would be useful to include, please point to the model and observational data set(s) and we’ll try and include that too. We should have the Arctic sea ice trends up shortly for instance.

Filed Under: Climate modelling, Climate Science, Instrumental Record

The underestimated danger of a breakdown of the Gulf Stream System

4 Jan 2017 by Stefan

A new model simulation of the Gulf Stream System shows a breakdown of the gigantic overturning circulating in the Atlantic after a CO2 doubling.

A new study in Science Advances by Wei Liu and colleagues at the Scripps Institution of Oceanography in San Diego and the University of Wisconsin-Madison has important implications for the future stability of the overturning circulation in the Atlantic Ocean. They applied a correction to the freshwater fluxes in the Atlantic, in order to better reproduce the salt concentration of ocean waters there. This correction changes the overall salt budget for the Atlantic, also changing the stability of the model’s ocean circulation in future climate change. The Atlantic ocean circulation is relatively stable in the uncorrected model, only declining by about 20% in response to a CO2 doubling, but in the corrected model version it breaks down completely in the centuries following a CO2 doubling, with dramatic consequences for the climate of the Northern Hemisphere. [Read more…] about The underestimated danger of a breakdown of the Gulf Stream System

Filed Under: Climate modelling, Climate Science, Oceans

Tuning in to climate models

30 Oct 2016 by Gavin

There is an interesting news article ($) in Science this week by Paul Voosen on the increasing amount of transparency on climate model tuning. (Full disclosure, I spoke to him a couple of times for this article and I’m working on tuning description paper for the US climate modeling centers). The main points of the article are worth highlighting here, even if a few of the characterizations are slightly off.

[Read more…] about Tuning in to climate models

Filed Under: Climate modelling, Climate Science, Reporting on climate

Q & A about the Gulf Stream System slowdown and the Atlantic ‘cold blob’

14 Oct 2016 by Stefan

Last weekend, in Reykjavik the Arctic Circle Assembly was held, the large annual conference on all aspects of the Arctic. A topic of this year was: What’s going on in the North Atlantic? This referred to the conspicuous ‘cold blob’ in the subpolar Atlantic, on which there were lectures and a panel discussion (Reykjavik University had invited me to give one of the talks). Here I want to provide a brief overview of the issues discussed.

What is the ‘cold blob’?

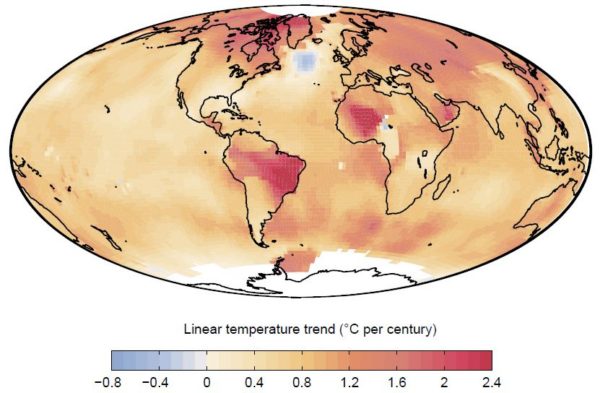
This refers to exceptionally cold water in the subpolar Atlantic south of Greenland. In our paper last year we have shown it like this (see also our RealClimate post about it):

fig1a_new

Fig. 1 Linear temperature trends from 1901 to 2013 according to NASA data. Source: Rahmstorf et al, Nature Climate Change 2015.

[Read more…] about Q & A about the Gulf Stream System slowdown and the Atlantic ‘cold blob’

Filed Under: Climate conference report, Climate modelling, Climate Science, Oceans, Paleoclimate

The Snyder Sensitivity Situation

26 Sep 2016 by Gavin

Nature published a great new reconstruction of global temperatures over the past 2 million years today. Snyder (2016) uses 61 temperature reconstructions from 59 globally diverse sediment cores and a correlation structure from model simulations of the last glacial maximum to estimate (with uncertainties) the history of global temperature back through the last few dozen ice ages cycles. There are multiple real things to discuss about this – the methodology, the relatively small number of cores being used (compared to what could have been analyzed), the age modeling etc. – and many interesting applications – constraints on polar amplification, the mid-Pleistocene transition, the duration and nature of previous interglacials – but unfortunately, the bulk of the attention will be paid to a specific (erroneous) claim about Earth System Sensitivity (ESS) that made it into the abstract and was the lead conclusion in the press release.

The paper claims that ESS is ~9ºC and that this implies that the long term committed warming from today’s CO2 levels is a further 3-7ºC. This is simply wrong.

[Read more…] about The Snyder Sensitivity Situation

References

  1. C.W. Snyder, "Evolution of global temperature over the past two million years", Nature, vol. 538, pp. 226-228, 2016. http://dx.doi.org/10.1038/nature19798

Filed Under: Climate modelling, Climate Science, Oceans, Paleoclimate

Do regional climate models add value compared to global models?

22 May 2016 by rasmus

2016-05-20 10.08.17

Global climate models (GCM) are designed to simulate earth’s climate over the entire planet, but they have a limitation when it comes to describing local details due to heavy computational demands. There is a nice TED talk by Gavin that explains how climate models work.

We need to apply downscaling to compute the local details. Downscaling may be done through empirical-statistical downscaling (ESD) or regional climate models (RCMs) with a much finer grid. Both take the crude (low-resolution) solution provided by the GCMs and include finer topographical details (boundary conditions) to calculate more detailed information. However, does more details translate to a better representation of the world?

The question of “added value” was an important topic at the International Conference on Regional Climate conference hosted by CORDEX of the World Climate Research Programme (WCRP). The take-home message was mixed on whether RCMs provide a better description of local climatic conditions than the coarser GCMs.

[Read more…] about Do regional climate models add value compared to global models?

Filed Under: Climate impacts, Climate modelling, Climate Science, downscaling, Reporting on climate, statistics

Comparing models to the satellite datasets

7 May 2016 by Gavin

How should one make graphics that appropriately compare models and observations? There are basically two key points (explored in more depth here) – comparisons should be ‘like with like’, and different sources of uncertainty should be clear, whether uncertainties are related to ‘weather’ and/or structural uncertainty in either the observations or the models. There are unfortunately many graphics going around that fail to do this properly, and some prominent ones are associated with satellite temperatures made by John Christy. This post explains exactly why these graphs are misleading and how more honest presentations of the comparison allow for more informed discussions of why and how these records are changing and differ from models.
[Read more…] about Comparing models to the satellite datasets

Filed Under: Climate modelling, Climate Science, El Nino, Greenhouse gases, Instrumental Record, IPCC, Model-Obs Comparisons, statistics

Millennia of sea-level change

22 Feb 2016 by Stefan

How has global sea level changed in the past millennia? And how will it change in this century and in the coming millennia? What part do humans play? Several new papers provide new insights.

2500 years of past sea level variations

This week, a paper will appear in the Proceedings of the National Academy of Sciences (PNAS) with the first global statistical analysis of numerous individual studies of the history of sea level over the last 2500 years (Kopp et al. 2016 – I am one of the authors). Such data on past sea level changes before the start of tide gauge measurements can be obtained from drill cores in coastal sediments. By now there are enough local data curves from different parts of the world to create a global sea level curve.

Let’s right away look at the main result. The new global sea level history looks like this:

Kopp2016_Fig1a+sat

Fig. 1 Reconstruction of the global sea-level evolution based on proxy data from different parts of the world. The red line at the end (not included in the paper) illustrates the further global increase since 2000 by 5-6 cm from satellite data. [Read more…] about Millennia of sea-level change

References

  1. R.E. Kopp, A.C. Kemp, K. Bittermann, B.P. Horton, J.P. Donnelly, W.R. Gehrels, C.C. Hay, J.X. Mitrovica, E.D. Morrow, and S. Rahmstorf, "Temperature-driven global sea-level variability in the Common Era", Proceedings of the National Academy of Sciences, vol. 113, 2016. http://dx.doi.org/10.1073/pnas.1517056113

Filed Under: Arctic and Antarctic, Climate impacts, Climate modelling, Climate Science, Oceans, Paleoclimate

Marvel et al (2015) Part III: Response to Nic Lewis

9 Feb 2016 by Gavin

The first post in this series gave the basic summary of Marvel et al (2015) (henceforth MEA15) and why I think it is an important paper. The second discussed some of the risible immediate media coverage. But there has also been an ‘appraisal’ of the paper by Nic Lewis that has appeared in no fewer than three other climate blogs (you can guess which). This is a response to the more interesting of his points.

[Read more…] about Marvel et al (2015) Part III: Response to Nic Lewis

References

  1. K. Marvel, G.A. Schmidt, R.L. Miller, and L.S. Nazarenko, "Implications for climate sensitivity from the response to individual forcings", Nature Climate Change, vol. 6, pp. 386-389, 2015. http://dx.doi.org/10.1038/nclimate2888

Filed Under: Aerosols, Climate modelling, Climate Science, Greenhouse gases, Instrumental Record

  • « Go to Previous Page
  • Page 1
  • Interim pages omitted …
  • Page 7
  • Page 8
  • Page 9
  • Page 10
  • Page 11
  • Interim pages omitted …
  • Page 24
  • Go to Next Page »

Primary Sidebar

Search

Search for:

Email Notification

get new posts sent to you automatically (free)
Loading

Recent Posts

  • Unforced Variations: Aug 2025
  • Are direct water vapor emissions endangering anyone?
  • The Endangerment of the Endangerment Finding?
  • National Climate Assessment links
  • Ocean circulation going South?
  • Melange à Trois

Our Books

Book covers
This list of books since 2005 (in reverse chronological order) that we have been involved in, accompanied by the publisher’s official description, and some comments of independent reviewers of the work.
All Books >>

Recent Comments

  • Will on The Endangerment of the Endangerment Finding?
  • Victor on Unforced Variations: Aug 2025
  • Piotr on The Endangerment of the Endangerment Finding?
  • Ray Ladbury on Unforced Variations: Aug 2025
  • Ray Ladbury on Unforced Variations: Aug 2025
  • Piotr on Are direct water vapor emissions endangering anyone?
  • Piotr on Are direct water vapor emissions endangering anyone?
  • David on The Endangerment of the Endangerment Finding?
  • David on The Endangerment of the Endangerment Finding?
  • Jonathan David on Unforced Variations: Aug 2025
  • Susan Anderson on Unforced Variations: Aug 2025
  • Kevin McKinney on The Endangerment of the Endangerment Finding?
  • Tomáš Kalisz on Unforced Variations: Aug 2025
  • Tomáš Kalisz on Are direct water vapor emissions endangering anyone?
  • Susan Anderson on The Endangerment of the Endangerment Finding?
  • Susan Anderson on The Endangerment of the Endangerment Finding?
  • David on Unforced Variations: Aug 2025
  • David on Unforced Variations: Aug 2025
  • Tomáš Kalisz on Are direct water vapor emissions endangering anyone?
  • David on Unforced Variations: Aug 2025

Footer

ABOUT

  • About
  • Translations
  • Privacy Policy
  • Contact Page
  • Login

DATA AND GRAPHICS

  • Data Sources
  • Model-Observation Comparisons
  • Surface temperature graphics
  • Miscellaneous Climate Graphics

INDEX

  • Acronym index
  • Index
  • Archives
  • Contributors

Realclimate Stats

1,374 posts

11 pages

245,219 comments

Copyright © 2025 · RealClimate is a commentary site on climate science by working climate scientists for the interested public and journalists.