• Skip to primary navigation
  • Skip to main content
  • Skip to primary sidebar
  • Skip to footer

RealClimate

Climate science from climate scientists...

  • Start here
  • Model-Observation Comparisons
  • Miscellaneous Climate Graphics
  • Surface temperature graphics
You are here: Home / Archives for Climate Science / Climate modelling

Climate modelling

OHC Model/Obs Comparison Errata

22 May 2012 by Gavin

This is just a brief note to point out that a few graphs that I have put together showing Ocean Heat Content changes in recent decades had an incorrect scaling for the GISS model data. My error was in assuming that the model output (which were in units W yr/m2) were scaled for the ocean area only, when in fact they were scaled for the entire global surface area (see fig. 2 in Hansen et al, 2005). Therefore, in converting to units of 1022 Joules for the absolute ocean heat content change, I had used a factor of 1.1 (0.7 x 5.1 x 365 x 3600 x 24 x 10-8), instead of the correct value of 1.61 (5.1 x 365 x 3600 x 24 x 10-8). This problem came to light while we were redoing this analysis for the CMIP5 models and from conversations with dana1981 at skepticalscience.com.

These graphs appeared in Dec 2009, May 2010, Jan 2011 and Feb 2012. In each case, I have replaced the graph with a corrected version while leaving a link to the incorrect version. Links to the figures will return the corrected image (and this is noted on the image itself). Where possible I used the data that were current at the time of the original post. Fortunately this only affects the figures used in these blog postings and not in any publications. Apologies for any confusion.

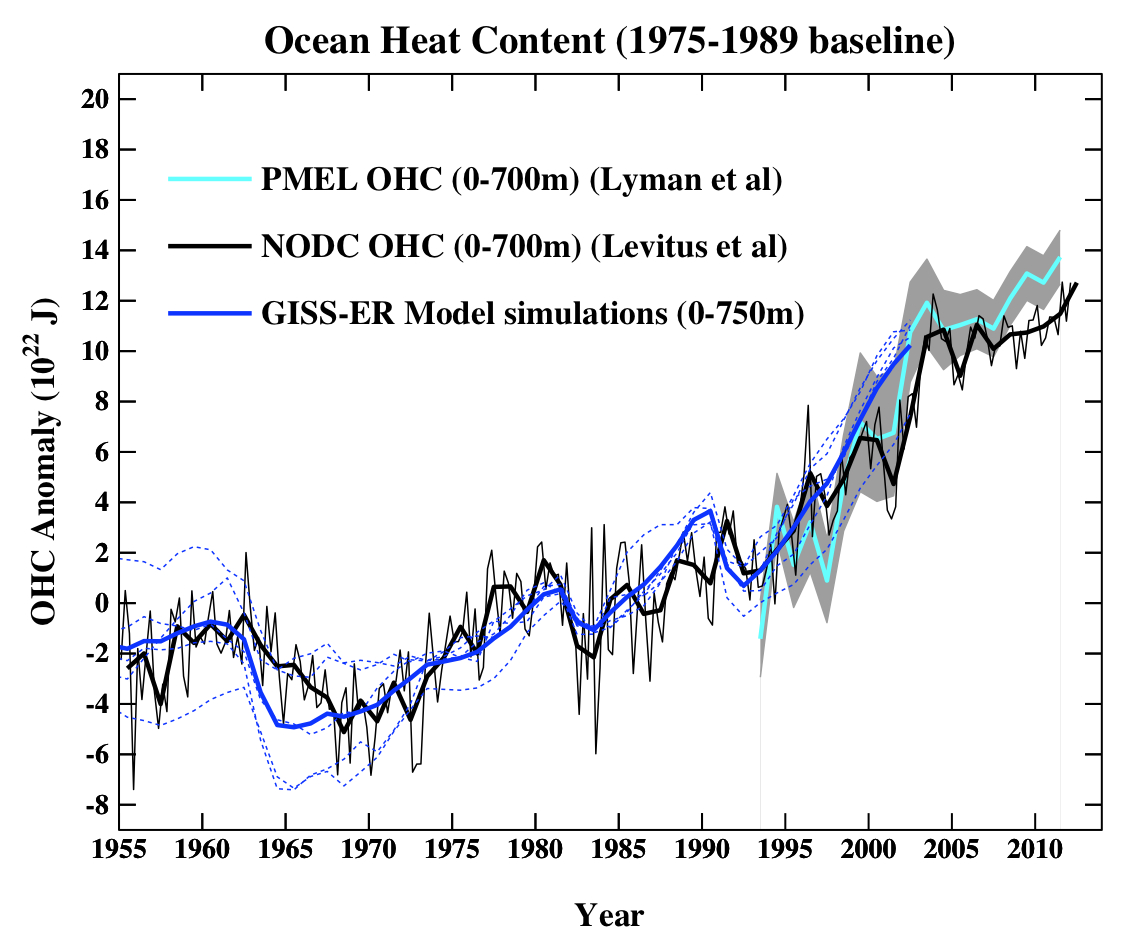
This figure shows the comparison using the most up-to-date observational products (NODC, PMEL):

The basic picture is unchanged – model simulations were able to capture the historical variance in OHC (as best we know it now – there remains significant structural uncertainty in those estimates). There are clear dips related volcanic eruptions (Agung, El Chichon, Pinatubo), and an sharp increase in the 1990s. Note that in GISS-EH (same AGCM but with a different ocean model) OHC increases at a slightly slower rate than seen with GISS-ER above. Looking at the last decade, it is clear that the observed rate of change of upper ocean heat content is a little slower than previously (and below linear extrapolations of the pre-2003 model output), and it remains unclear to what extent that is related to a reduction in net radiative forcing growth (due to the solar cycle, or perhaps larger than expected aerosol forcing growth), or internal variability, model errors, or data processing – arguments have been made for all four, singly and together.

Analyses of the CMIP5 models will provide some insight here since the historical simulations have been extended to 2012 (including the last solar minimum), and have updated aerosol emissions. Watch this space.

References

  1. J. Hansen, L. Nazarenko, R. Ruedy, M. Sato, J. Willis, A. Del Genio, D. Koch, A. Lacis, K. Lo, S. Menon, T. Novakov, J. Perlwitz, G. Russell, G.A. Schmidt, and N. Tausnev, "Earth's Energy Imbalance: Confirmation and Implications", Science, vol. 308, pp. 1431-1435, 2005. http://dx.doi.org/10.1126/science.1110252

Filed Under: Climate modelling, Climate Science, Oceans

Another fingerprint

20 May 2012 by rasmus

When my kids were younger, they asked me why the ocean was blue. I would answer that the ocean mirrors the blue sky. However, I would not think much more about it, even though it is well-known that the oceans represent the most important source for atmospheric moisture. They also play an important role for many types of internal variations, such as the El Nino Southern Oscillation. Now a new study by Durack et al. (2012) has been published in Science that presents the relationship between the oceans and the atmosphere.

[Read more…] about Another fingerprint

References

  1. P.J. Durack, S.E. Wijffels, and R.J. Matear, "Ocean Salinities Reveal Strong Global Water Cycle Intensification During 1950 to 2000", Science, vol. 336, pp. 455-458, 2012. http://dx.doi.org/10.1126/science.1212222

Filed Under: Climate modelling, Climate Science, hydrological cycle, Oceans

Plugging the leaks

17 May 2012 by group

Guest commentary by Beate Liepert, NWRA

Clouds and water vapor accounts for only a tiny fraction of all water on Earth, but in spite of it, this moisture in the atmosphere is crucially important to replenishing drinking water reservoirs, crop yields, distribution of vegetation zones, and so on. This is the case because in the atmosphere, clouds and water vapor, transports a vast amount of water from oceans to land, where it falls out as precipitation. Scientists generally agree that rising temperatures in the coming decades will affect this cycling of water. And most climate models successfully simulate a global intensification of rainfall. However, physical models often disagree with observations and amongst themselves on the amount of the intensification, and global distribution of moisture that defines dry and wet regions.
[Read more…] about Plugging the leaks

Filed Under: Climate impacts, Climate modelling, Climate Science

Arctic Sea Ice Volume: PIOMAS, Prediction, and the Perils of Extrapolation

11 Apr 2012 by group

Guest Commentary by Axel Schweiger, Ron Lindsay, and Cecilia Bitz

We have just passed the annual maximum in Arctic sea ice extent which always occurs sometime in March. Within a month we will reach the annual maximum in Arctic sea ice volume. After that, the sea ice will begin its course towards its annual minimum of both extent and volume in mid-September. This marks the beginning of the ritual of the annual sea ice watch that includes predictions of the extent and rank of this year’s sea ice minimum, as well as discussion about the timing of its eventual demise. One of the inputs into that discussion is the “PIOMAS” ice-ocean model output of ice volume – and in particular, some high-profile extrapolations. This is worth looking at in some detail.

[Read more…] about Arctic Sea Ice Volume: PIOMAS, Prediction, and the Perils of Extrapolation

Filed Under: Arctic and Antarctic, Climate modelling, Climate Science

Evaluating a 1981 temperature projection

2 Apr 2012 by group

Guest commentary from Geert Jan van Oldenborgh and Rein Haarsma, KNMI

Sometimes it helps to take a step back from the everyday pressures of research (falling ill helps). It was in this way we stumbled across Hansen et al (1981) (pdf). In 1981 the first author of this post was in his first year at university and the other just entered the KNMI after finishing his masters. Global warming was not yet an issue at the KNMI where the focus was much more on climate variability, which explains why the article of Hansen et al. was unnoticed at that time by the second author. It turns out to be a very interesting read.
[Read more…] about Evaluating a 1981 temperature projection

References

  1. J. Hansen, D. Johnson, A. Lacis, S. Lebedeff, P. Lee, D. Rind, and G. Russell, "Climate Impact of Increasing Atmospheric Carbon Dioxide", Science, vol. 213, pp. 957-966, 1981. http://dx.doi.org/10.1126/science.213.4511.957

Filed Under: Climate modelling, Climate Science, Greenhouse gases, Instrumental Record

Bickmore on the WSJ response

24 Feb 2012 by group

Guest commentary from Barry Bickmore (repost)

The Wall Street Journal posted yet another op-ed by 16 scientists and engineers, which even include a few climate scientists(!!!). Here is the editor’s note to explain the context.

Editor’s Note: The authors of the following letter, listed below, are also the signatories of“No Need to Panic About Global Warming,” an op-ed that appeared in the Journal on January 27. This letter responds to criticisms of the op-ed made by Kevin Trenberth and 37 others in a letter published Feb. 1, and by Robert Byer of the American Physical Society in a letter published Feb. 6.

A relative sent me the article, asking for my thoughts on it. Here’s what I said in response.
[Read more…] about Bickmore on the WSJ response

Filed Under: Climate modelling, Climate Science, Instrumental Record, IPCC

2011 Updates to model-data comparisons

8 Feb 2012 by Gavin

And so it goes – another year, another annual data point. As has become a habit (2009, 2010), here is a brief overview and update of some of the most relevant model/data comparisons. We include the standard comparisons of surface temperatures, sea ice and ocean heat content to the AR4 and 1988 Hansen et al simulations.
[Read more…] about 2011 Updates to model-data comparisons

Filed Under: Climate modelling, Climate Science, El Nino, Greenhouse gases, Instrumental Record, Model-Obs Comparisons

The AR4 attribution statement

29 Jan 2012 by Gavin

Back in 2007, the IPCC AR4 SPM stated that:

“Most of the observed increase in global average temperatures since the mid-20th century is very likely due to the observed increase in anthropogenic greenhouse gas concentrations.”

This is a clear statement that I think is very well supported and correctly reflects the opinion of most climate scientists on the subject (and was re-affirmed in two recent papers (Jones and Stott, 2011;, Huber and Knutti, 2011)). It isn’t an isolated conclusion from a single study, but comes from an assessment of the changing patterns of surface and tropospheric warming, stratospheric cooling, ocean heat content changes, land-ocean contrasts, etc. that collectively demonstrate that there are detectable changes occurring which we can attempt to attribute to one or more physical causes.

Yet, in a paper just out in BAMS (Curry and Webster, 2011) this statement is apparently evidence that IPCC is unable to deal with uncertainty. Furthermore, Judith Curry has reiterated on her blog that the term ‘most’ is imprecise and undefined. For instance:

Apart from the undefined meaning of “most” in AR4 (which was subsequently clarified by the IPCC), the range 50.1-95% is rather imprecise in the context of attribution.

However, Curry’s argument is far from convincing, nor is it well formed (why is there a cap at 95%?). Nor was it convincing when I discussed the issue with her in the comments at Collide-a-Scape last year where she made similar points. Since the C&W paper basically repeats that argument (as has also been noticed by Gabi Hegerl et al who have a comment on the paper (Hegerl et al.)), it is perhaps worth addressing these specific issues again.
[Read more…] about The AR4 attribution statement

References

  1. G.S. Jones, and P.A. Stott, "Sensitivity of the attribution of near surface temperature warming to the choice of observational dataset", Geophysical Research Letters, vol. 38, pp. n/a-n/a, 2011. http://dx.doi.org/10.1029/2011GL049324
  2. M. Huber, and R. Knutti, "Anthropogenic and natural warming inferred from changes in Earth’s energy balance", Nature Geoscience, vol. 5, pp. 31-36, 2011. http://dx.doi.org/10.1038/ngeo1327
  3. J.A. Curry, and P.J. Webster, "Climate Science and the Uncertainty Monster", Bulletin of the American Meteorological Society, vol. 92, pp. 1667-1682, 2011. http://dx.doi.org/10.1175/2011BAMS3139.1
  4. G. Hegerl, P. Stott, S. Solomon, and F. Zwiers, "Comment on “Climate Science and the Uncertainty Monster” J. A. Curry and P. J. Webster", Bulletin of the American Meteorological Society, vol. 92, pp. 1683-1685, 2011. http://dx.doi.org/10.1175/BAMS-D-11-00191.1

Filed Under: Climate modelling, Climate Science, Instrumental Record, IPCC

Ice age constraints on climate sensitivity

28 Nov 2011 by group

There is a new paper on Science Express that examines the constraints on climate sensitivity from looking at the last glacial maximum (LGM), around 21,000 years ago (Schmittner et al, 2011) (SEA). The headline number (2.3ºC) is a little lower than IPCC’s “best estimate” of 3ºC global warming for a doubling of CO2, but within the likely range (2-4.5ºC) of the last IPCC report. However, there are reasons to think that the result may well be biased low, and stated with rather more confidence than is warranted given the limitations of the study.

[Read more…] about Ice age constraints on climate sensitivity

References

  1. A. Schmittner, N.M. Urban, J.D. Shakun, N.M. Mahowald, P.U. Clark, P.J. Bartlein, A.C. Mix, and A. Rosell-Melé, "Climate Sensitivity Estimated from Temperature Reconstructions of the Last Glacial Maximum", Science, vol. 334, pp. 1385-1388, 2011. http://dx.doi.org/10.1126/science.1203513

Filed Under: Climate modelling, Climate Science, Paleoclimate

Conference conversations

4 Nov 2011 by rasmus

Rasmus & Gavin

The reason why scientists like going to conferences (despite them often being held in stuffy hotel basements) is because of the conversations. People can be found who know what they are talking about, and discussions can be focused clearly on what is important, rather than what is trivial. The atmosphere at these conferences is a mix of excitement and expectations as well as pleasure at seeing old friends and colleagues.

The two of us just got back from the excellent ‘Open Science Conference‘ organised by the World Climate Research Programme (WCRP) in Denver Colorado. More than 1900 scientists participated from 86 different countries, and the speakers included the biggest names in climate research and many past and present IPCC authors.

Open Science Conference

[Read more…] about Conference conversations

Filed Under: Climate modelling, Climate Science, Communicating Climate, Scientific practice

  • « Go to Previous Page
  • Page 1
  • Interim pages omitted …
  • Page 12
  • Page 13
  • Page 14
  • Page 15
  • Page 16
  • Interim pages omitted …
  • Page 24
  • Go to Next Page »

Primary Sidebar

Search

Search for:

Email Notification

get new posts sent to you automatically (free)
Loading

Recent Posts

  • Unforced variations: Oct 2025
  • “But you said the ice was going to disappear in 10 years!”
  • Time and Tide Gauges wait for no Voortman
  • Lil’ NAS Express
  • DOE CWG Report “Moot”?
  • Climate Scientists response to DOE report

Our Books

Book covers
This list of books since 2005 (in reverse chronological order) that we have been involved in, accompanied by the publisher’s official description, and some comments of independent reviewers of the work.
All Books >>

Recent Comments

  • Geoff Miell on Unforced variations: Oct 2025
  • Mo Yunus on “But you said the ice was going to disappear in 10 years!”
  • Piotr on “But you said the ice was going to disappear in 10 years!”
  • Piotr on “But you said the ice was going to disappear in 10 years!”
  • Piotr on “But you said the ice was going to disappear in 10 years!”
  • Tomáš Kalisz on Unforced variations: Oct 2025
  • Mo Yunus on “But you said the ice was going to disappear in 10 years!”
  • Mal Adapted on “But you said the ice was going to disappear in 10 years!”
  • Tomáš Kalisz on “But you said the ice was going to disappear in 10 years!”
  • nigelj on Unforced variations: Oct 2025
  • Tomáš Kalisz on Unforced variations: Oct 2025
  • Russell Seitz on “But you said the ice was going to disappear in 10 years!”
  • Kevin McKinney on “But you said the ice was going to disappear in 10 years!”
  • Kevin McKinney on Unforced variations: Oct 2025
  • Kevin McKinney on “But you said the ice was going to disappear in 10 years!”
  • MA Rodger on Unforced variations: Oct 2025
  • MA Rodger on Unforced variations: Oct 2025
  • MA Rodger on Unforced variations: Oct 2025
  • Barton Paul Levenson on Unforced variations: Oct 2025
  • Barton Paul Levenson on “But you said the ice was going to disappear in 10 years!”
  • Silvia Leahu-Aluas on Unforced variations: Oct 2025
  • Pete best on “But you said the ice was going to disappear in 10 years!”
  • Susan Anderson on “But you said the ice was going to disappear in 10 years!”
  • Mo Yunus on Unforced variations: Oct 2025
  • Geoff Miell on Unforced variations: Oct 2025
  • Russell Seitz on “But you said the ice was going to disappear in 10 years!”
  • Mo Yunus on “But you said the ice was going to disappear in 10 years!”
  • Mo Yunus on “But you said the ice was going to disappear in 10 years!”
  • Mo Yunus on “But you said the ice was going to disappear in 10 years!”
  • Piotr on Unforced variations: Oct 2025

Footer

ABOUT

  • About
  • Translations
  • Privacy Policy
  • Contact Page
  • Login

DATA AND GRAPHICS

  • Data Sources
  • Model-Observation Comparisons
  • Surface temperature graphics
  • Miscellaneous Climate Graphics

INDEX

  • Acronym index
  • Index
  • Archives
  • Contributors

Realclimate Stats

1,383 posts

11 pages

247,251 comments

Copyright © 2025 · RealClimate is a commentary site on climate science by working climate scientists for the interested public and journalists.