As previewed last weekend, I spent most of last week at a workshop on Climate Sensitivity hosted by the Max Planck Institute at Schloss Ringberg. It was undoubtedly one of the better workshops I’ve attended – it was focussed, deep and with much new information to digest (some feel for the discussion can be seen from the #ringberg15 tweets). I’ll give a brief overview of my impressions below.
Instrumental Record
Climate Sensitivity Week
 Some of you will be aware that there is a workshop on Climate Sensitivity this week at Schloss Ringberg in southern Germany. The topics to be covered include how sensitivity is defined (and whether it is even meaningful (Spoiler, yes it is)), what it means, how it can be constrained, what the different flavours signify etc. There is an impressive list of attendees with a very diverse range of views on just about everything, and so I am looking forward to very stimulating discussions.
Noise on the Telegraph
I was surprised by the shrill headlines from a British newspaper with the old fashioned name the Telegraph: “The fiddling with temperature data is the biggest science scandal ever”. So what is this all about?
Thoughts on 2014 and ongoing temperature trends
Last Friday, NASA GISS and NOAA NCDC had a press conference and jointly announced the end-of-year analysis for the 2014 global surface temperature anomaly which, in both analyses, came out top. As you may have noticed, this got much more press attention than their joint announcement in 2013 (which wasn’t a record year).
In press briefings and interviews I contributed to, I mostly focused on two issues – that 2014 was indeed the warmest year in those records (though by a small amount), and the continuing long-term trends in temperature which, since they are predominantly driven by increases in greenhouse gases, are going to continue and hence produce (on a fairly regular basis) continuing record years. Response to these points has been mainly straightforward, which is good (if sometimes a little surprising), but there have been some interesting issues raised as well…
[Read more…] about Thoughts on 2014 and ongoing temperature trends
A new sea level curve
The “zoo” of global sea level curves calculated from tide gauge data has grown – tomorrow a new reconstruction of our US colleagues around Carling Hay from Harvard University will appear in Nature (Hay et al. 2015). That is a good opportunity for an overview over the available data curves. The differences are really in the details, the “big picture” of sea-level rise does not change. In all curves, the current rates of rise are the highest since records began.
The following graph shows the new sea level curve as compared to six known ones.
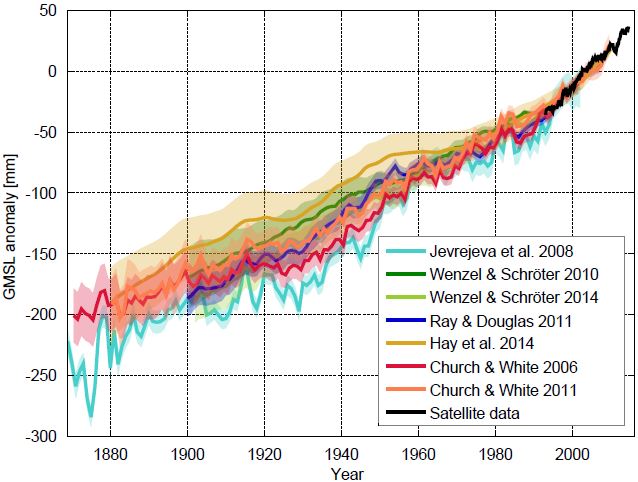
Fig 1 Sea level curves calculated by different research groups with various methods. The curves show the sea level relative to the satellite era (since 1992). Graph: Klaus Bittermann.
All curves show the well-known modern sea level rise, but the exact extent and time evolution of the rise differ somewhat. Up to about 1970, the new reconstruction of Hay et al. runs at the top of the existing uncertainty range. For the period from 1880 AD, however, it shows the same total increase as the current favorites by Church & White. Starting from 1900 AD it is about 25 mm less. This difference is at the margins of significance: the uncertainty ranges overlap. [Read more…] about A new sea level curve
References
- C.C. Hay, E. Morrow, R.E. Kopp, and J.X. Mitrovica, "Probabilistic reanalysis of twentieth-century sea-level rise", Nature, vol. 517, pp. 481-484, 2015. http://dx.doi.org/10.1038/nature14093
Absolute temperatures and relative anomalies
Most of the images showing the transient changes in global mean temperatures (GMT) over the 20th Century and projections out to the 21st C, show temperature anomalies. An anomaly is the change in temperature relative to a baseline which usually the pre-industrial period, or a more recent climatology (1951-1980, or 1980-1999 etc.). With very few exceptions the changes are almost never shown in terms of absolute temperatures. So why is that?
[Read more…] about Absolute temperatures and relative anomalies
The most popular deceptive climate graph
The “World Climate Widget” from Tony Watts’ blog is probably the most popular deceptive image among climate “skeptics”. We’ll take it under the microscope and show what it would look like when done properly.
So called “climate skeptics” deploy an arsenal of misleading graphics, with which the human influence on the climate can be down played (here are two other examples deconstructed at Realclimate). The image below is especially widespread. It is displayed on many “climate skeptic” websites and is regularly updated.
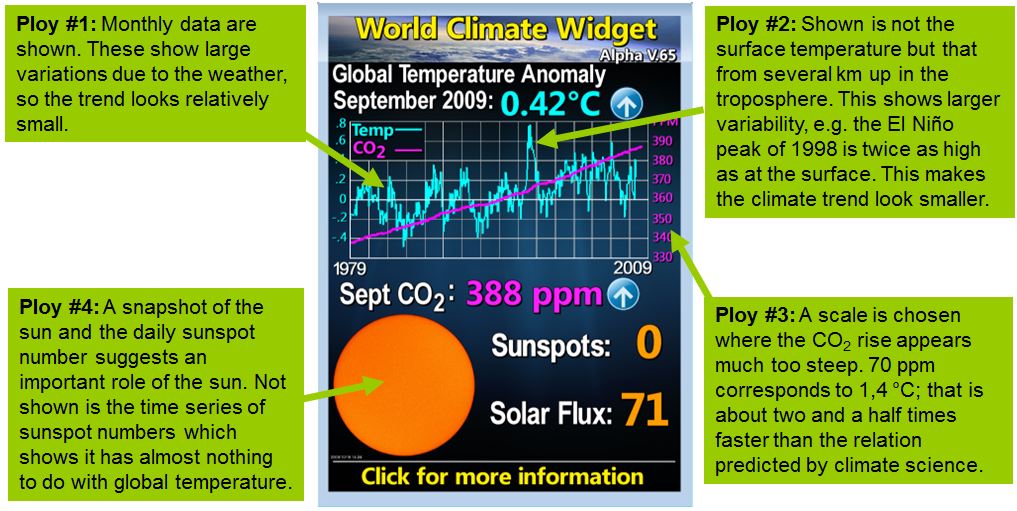
The “World Climate Widget” of US “climate skeptic” Anthony Watts with our explanations added. The original can be found on Watts’ blog
What would a more honest display of temperature, CO2 and sunspots look like? [Read more…] about The most popular deceptive climate graph
Recent global warming trends: significant or paused or what?
As the World Meteorological Organisation WMO has just announced that “The year 2014 is on track to be the warmest, or one of the warmest years on record”, it is timely to have a look at recent global temperature changes.
I’m going to use Kevin Cowtan’s nice interactive temperature plotting and trend calculation tool to provide some illustrations. I will be using the HadCRUT4 hybrid data, which have the most sophisticated method to fill data gaps in the Arctic with the help of satellites, but the same basic points can be illustrated with other data just as well.
Let’s start by looking at the full record, which starts in 1979 since the satellites come online there (and it’s not long after global warming really took off).
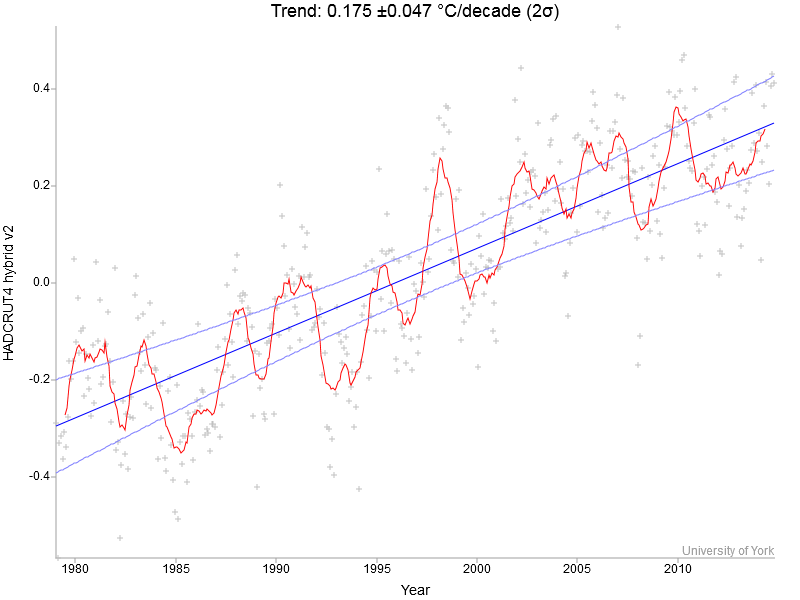 Fig. 1. Global temperature 1979 to present – monthly values (crosses), 12-months running mean (red line) and linear trend line with uncertainty (blue) [Read more…] about Recent global warming trends: significant or paused or what?
Ocean heat storage: a particularly lousy policy target + Update
The New York Times, 12 December 2027: After 12 years of debate and negotiation, kicked off in Paris in 2015, world leaders have finally agreed to ditch the goal of limiting global warming to below 2 °C. Instead, they have agreed to the new goal of limiting global ocean heat content to 1024 Joules. The decision was widely welcomed by the science and policy communities as a great step forward. “In the past, the 2 °C goal has allowed some governments to pretend that they are taking serious action to mitigate global warming, when in reality they have achieved almost nothing. I’m sure that this can’t happen again with the new 1024 Joules goal”, said David Victor, a professor of international relations who originally proposed this change back in 2014. And an unnamed senior EU negotiator commented: “Perhaps I shouldn’t say this, but some heads of state had trouble understanding the implications of the 2 °C target; sometimes they even accidentally talked of limiting global warming to 2%. I’m glad that we now have those 1024 Joules which are much easier to grasp for policy makers and the public.”
This fictitious newspaper item is of course absurd and will never become reality, because ocean heat content is unsuited as a climate policy target. Here are three main reasons why. [Read more…] about Ocean heat storage: a particularly lousy policy target + Update
Climate response estimates from Lewis & Curry
Guest commentary from Richard Millar (U. Oxford)
The recent Lewis and Curry study of climate sensitivity estimated from the transient surface temperature record is being lauded as something of a game-changer – but how much of a game-changer is it really?
[Read more…] about Climate response estimates from Lewis & Curry
References
- N. Lewis, and J.A. Curry, "The implications for climate sensitivity of AR5 forcing and heat uptake estimates", Climate Dynamics, vol. 45, pp. 1009-1023, 2014. http://dx.doi.org/10.1007/s00382-014-2342-y