There is an interesting news article ($) in Science this week by Paul Voosen on the increasing amount of transparency on climate model tuning. (Full disclosure, I spoke to him a couple of times for this article and I’m working on tuning description paper for the US climate modeling centers). The main points of the article are worth highlighting here, even if a few of the characterizations are slightly off.
Climate Science
Q & A about the Gulf Stream System slowdown and the Atlantic ‘cold blob’
Last weekend, in Reykjavik the Arctic Circle Assembly was held, the large annual conference on all aspects of the Arctic. A topic of this year was: What’s going on in the North Atlantic? This referred to the conspicuous ‘cold blob’ in the subpolar Atlantic, on which there were lectures and a panel discussion (Reykjavik University had invited me to give one of the talks). Here I want to provide a brief overview of the issues discussed.
What is the ‘cold blob’?
This refers to exceptionally cold water in the subpolar Atlantic south of Greenland. In our paper last year we have shown it like this (see also our RealClimate post about it):
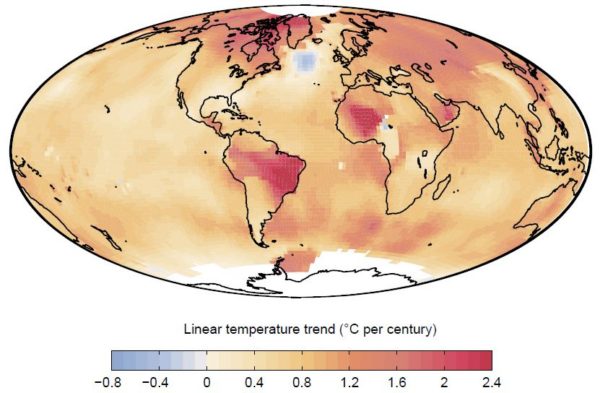
Fig. 1 Linear temperature trends from 1901 to 2013 according to NASA data. Source: Rahmstorf et al, Nature Climate Change 2015.
[Read more…] about Q & A about the Gulf Stream System slowdown and the Atlantic ‘cold blob’
Unforced Variations: Oct 2016
The Snyder Sensitivity Situation
Nature published a great new reconstruction of global temperatures over the past 2 million years today. Snyder (2016) uses 61 temperature reconstructions from 59 globally diverse sediment cores and a correlation structure from model simulations of the last glacial maximum to estimate (with uncertainties) the history of global temperature back through the last few dozen ice ages cycles. There are multiple real things to discuss about this – the methodology, the relatively small number of cores being used (compared to what could have been analyzed), the age modeling etc. – and many interesting applications – constraints on polar amplification, the mid-Pleistocene transition, the duration and nature of previous interglacials – but unfortunately, the bulk of the attention will be paid to a specific (erroneous) claim about Earth System Sensitivity (ESS) that made it into the abstract and was the lead conclusion in the press release.
The paper claims that ESS is ~9ºC and that this implies that the long term committed warming from today’s CO2 levels is a further 3-7ºC. This is simply wrong.
[Read more…] about The Snyder Sensitivity Situation
References
- C.W. Snyder, "Evolution of global temperature over the past two million years", Nature, vol. 538, pp. 226-228, 2016. http://dx.doi.org/10.1038/nature19798
Why correlations of CO2 and Temperature over ice age cycles don’t define climate sensitivity
We’ve all seen how well temperature proxies and CO2 concentrations are correlated in the Antarctic ice cores – this has been known since the early 1990’s and has featured in many high-profile discussions of climate change.
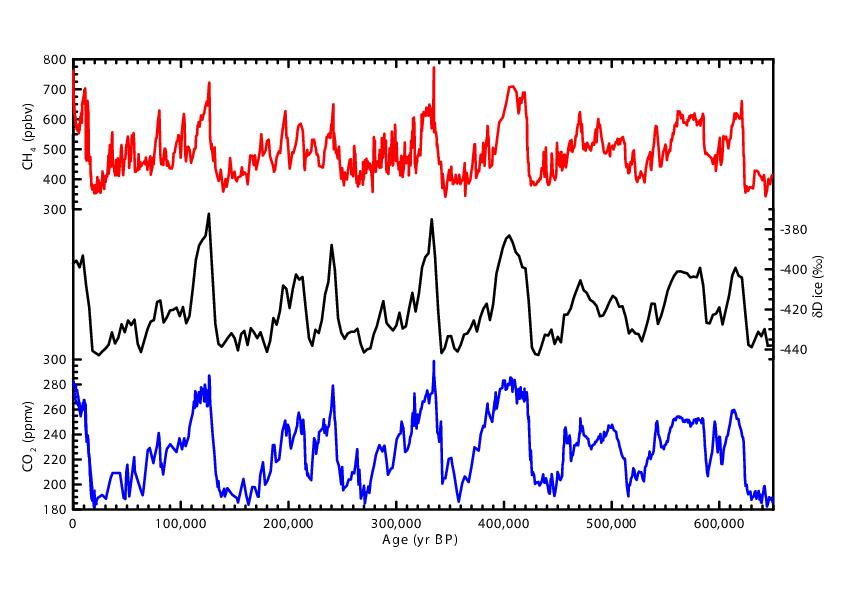
EPICA Dome C ice core greenhouse gas and isotope records.
The temperature proxies are water isotope ratios that can be used to estimate Antarctic temperatures and, via a scaling, the global values. The CO2 and CH4 concentration changes can be converted to radiative forcing in W/m2 based on standard formulas. These two timeseries can be correlated and the regression (in ºC/(W/m2)) has the units of climate sensitivity – but what does it represent?
Can a blanket violate the second law of thermodynamics?
One of the silliest arguments of climate deniers goes like this: the atmosphere with its greenhouse gases cannot warm the Earth’s surface, because it is colder than the surface. But heat always flows from warm to cold and never vice versa, as stated in the second law of thermodynamics.
The freshly baked Australian Senator Malcolm Roberts has recently phrased it thus in his maiden speech:
It is basic. The sun warms the earth’s surface. The surface, by contact, warms the moving, circulating atmosphere. That means the atmosphere cools the surface. How then can the atmosphere warm it? It cannot. That is why their computer models are wrong.
This is of course not only questions the increasing human-caused greenhouse effect, but in general our understanding of temperatures on all planets, which goes back to Joseph Fourier, who in 1824 was the first to understand the importance of the greenhouse effect.
The atmosphere acts like a blanket which inhibits heat loss. In fact according to Roberts’ logic, a blanket could also not have a warming effect:
It’s simple. The body warms the blanket. This means that the blanket cools the body. So how can the blanket warm it? It cannot!
The answer is simple. The warm body loses heat to the cold air. The blanket inhibits and slows this heat loss. Therefore you stay warmer under a blanket.
The Earth loses heat to the cold universe. The atmosphere inhibits this heat loss. Therefore, the surface remains warmer than it would be without the atmosphere.
It is true that the surface loses heat to the atmosphere – but less than it would otherwise lose directly to space. Just as I lose less heat to the blanket than I would otherwise lose to the air, without blanket.
Of course, in neither case is the second law of thermodynamics violated. The heat always flows from warm to cold – just more or less effectively. The processes of heat transfer are quite different – for the blanket it is mainly heat conduction, for the greenhouse effect it is thermal radiation. The climate deniers claim that the colder atmosphere cannot radiate thermal radiation towards the warmer surface. This is of course nonsense. The cool Earth also sends thermal radiation towards the hot sun – how would thermal radiation leaving Earth know how warm the surface is that it’s going to hit? It’s just that the sun sends more radiation back to us – the net flow is from hot to cold. More is not implied by the second law of thermodynamics.
Thanks to two Germans (Gerlich and Tscheuschner of the TU Braunscheig – deeply embarrassing for this university), the absurd claim that the greenhouse effect violates the second law of thermodynamics even made it into an obscure physics journal – obviously there was no peer review to speak of. The bizarre article was promptly demolished by some US physicists. Just recently I read the claim again in an article of coal lobbyist Lars Schernikau – with such fairy-tale beliefs of its representatives, one is not surprised by the decline of the coal industry.
The thermal radiation from the atmosphere toward the ground, which allegedly cannot exist, is of course routinely measured, including its increase (see e.g. Philipona et al. 2004, 2012).
And you can even feel it. Those who sometimes sit outside in the garden after dark know this. Under a dense, low cloud layer you do not nearly get cold as fast as on a clear starry night. This is due to the thermal radiation coming from the clouds. They are colder than our body, but warmer than the night sky in clear air.
Roberts said: “Like Socrates, I love asking questions to get to the truth.” Perhaps he will ponder my answer next time he sits in his garden at night, or slips under a blanket.
P.S.
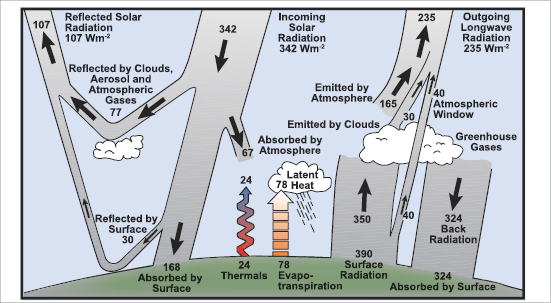
Here is the energy balance diagram for our Earth, explained in IPCC FAQ 1.1. The “Back Radiation” makes the greenhouse effect. It is larger than the solar radiation reaching the ground, and measured by a global radiation measurement network.
References
R. Philipona, “Radiative forcing – measured at Earth’s surface – corroborate the increasing greenhouse effect”, Geophys. Res. Lett., vol. 31, 2004. http://dx.doi.org/10.1029/2003GL018765
R. Philipona, A. Kräuchi, and E. Brocard, “Solar and thermal radiation profiles and radiative forcing measured through the atmosphere”, Geophys. Res. Lett., vol. 39, pp. n/a-n/a, 2012. http://dx.doi.org/10.1029/2012GL052087
What is new in European climate research?

What did I learn from the 2016 annual European Meteorological Society (EMS) conference that last week was hosted in Trieste (Italy)?
[Read more…] about What is new in European climate research?
Predicting annual temperatures a year ahead
I have a post at Nate Silver’s 538 site on how we can predict annual surface temperature anomalies based on El Niño and persistence – including a (by now unsurprising) prediction for a new record in 2016 and a slightly cooler, but still very warm, 2017.
[Read more…] about Predicting annual temperatures a year ahead
An update on mid-latitude cyclones and climate change
Why is it so hard to say what the future North European climate will look like? A recent review paper by Shaw et al, 2016 explains the reason in persuasive terms.
[Read more…] about An update on mid-latitude cyclones and climate change
References
- T.A. Shaw, M. Baldwin, E.A. Barnes, R. Caballero, C.I. Garfinkel, Y. Hwang, C. Li, P.A. O'Gorman, G. Rivière, I.R. Simpson, and A. Voigt, "Storm track processes and the opposing influences of climate change", Nature Geoscience, vol. 9, pp. 656-664, 2016. http://dx.doi.org/10.1038/NGEO2783
Unforced variations: Sep 2016
To come this month: Arctic sea ice minimum, decisions from the IPCC scoping meeting on a report focused on the 1.5ºC target, interesting paleo-climate science at #ICP12 and a chance to stop arguing about politics perhaps.
Usual rules apply.