New email releases from the EDF/UCS lawsuit against the DOE provide a rarely-seen behind the curtain look at how the climate contrarians work.
[Read more…] about A peek behind the curtain…Scientific practice
AI/ML climate magic?
There has been a frenzy around artificial intelligence and deep machine learning (AI/ML) since the “ChatGPT Moment” in 2022, and AI/ML is for sure going to affect us all. It strikes me that this buzz also looks more like a science fiction story (utopy/dystopy) than the old-fashion Clondyke goldrush craze.
[Read more…] about AI/ML climate magic?“But you said the ice was going to disappear in 10 years!”
Almost two decades ago, some scientists predicted that Arctic summer sea ice would ‘soon’ disappear. These predictions were mentioned by Al Gore and got a lot of press. However, they did not gain wide acceptance in the scientific community, and were swiftly disproven. Unsurprisingly, this still comes up a lot. Time for a deeper dive into what happened and why…
[Read more…] about “But you said the ice was going to disappear in 10 years!”DOE CWG Report “Moot”?
Somewhat breaking news. A court filing (from 9/4) from DOE has noted that the Climate Working Group has been disbanded (as of 9/3). This was done to make the EDF/UCS lawsuit moot, but it also means that DOE is withdrawing the report, no-one will respond appropriately to the comments submitted, and (possibly) it becomes irrelevant for the EPA reconsideration of the Endangerment Finding.
What a farce.
Update: Via Andy Revkin, the EDF/UCS’s blistering response to the DOE filing. Pass the popcorn.
Climate Scientists response to DOE report
As we’ve mentioned, Andrew Dessler and Robert Kopp have been coordinating a scientific peer review of the DOW ‘CWG’ Critique of Climate Science. It is now out.
[Read more…] about Climate Scientists response to DOE reportMelange à Trois
In honor of the revelation today, that Koonin, Christy and Spencer have been made Special Government Employees at the Dept. of Energy, we present a quick round up of our commentary on the caliber of their arguments we’ve posted here over the last decade or so.
TL;DR? The arguments are not very good.
[Read more…] about Melange à TroisWe need NOAA now more than ever
Guest commentary by Robert Hart, Kerry Emanuel, & Lance Bosart

The National Weather Service (NWS) and its parent agency, the National Oceanic and Atmospheric
Administration (NOAA), delivers remarkable value to the taxpayers. This efficiency can be demonstrated by its enormous return on investment. For example, the NWS costs only several dollars per citizen to operate each year, yet results in an estimated 10-100 times larger financial return that includes: improved citizen preparedness, improved transportation efficiency and safety, increased private sector profits, improved disaster prevention and mitigation, and impressive scientific research innovation that is significantly also contributed to by other related federal agencies, the private sector, and the academic research community.
Recent NWS initiatives have even more directly connected weather and ocean observations and forecasts to emergency preparation and public impact. To quote a 2019 study referenced below, “Partnership with the NWS has revolutionized this Emergency Management community from on that reacts to events to one that proactively prepares and stays ahead of the extreme events.” The societal benefits of reasonably predicting the future cannot be understated, and such prediction and resulting benefits were unimaginable only 75 years ago.
Critical taxpayer-funded investments over the past decades have led to greatly improved weather forecast models, observations from the ocean, ground, aircraft, and space, and theoretical understanding through scientific research. These all have had an enormous impact on lives and property. The forecasts and associated critical watches and warnings we see every day on television, the internet, or phone apps could not be possible without NOAA and the NWS. It is estimated that the tax revenue generated from the private sector using NOAA data and services easily pays for the entire cost of the NWS.
Those who remember weather forecasts from the 1970s through 1980s can appreciate these dramatic evolutionary improvements given how inferior those forecasts were compared to today. Going further back, landfalling hurricanes in the first half of that century often came with no warning. If you read newspaper front pages from the mornings of September 7, 1900, or September 21, 1938, you will find there is no mention of the historic and catastrophic events about to unfold only hours later. This would be unthinkable today given the scientific investments we have paid for.
These massive improvements extend beyond hurricane (and also snowstorm) forecasting and preparedness. Tornado warning lead time has also improved markedly during the same time period. Casualty rates from tornadoes have not increased despite a very rapid increase in population. At minimum, hundreds of thousands of people are alive today who would not be without our investments in NOAA and NWS.
The advent of skillful weather forecasting, along with the increased preparedness it allows, remains a landmark achievement of not only this country but of the human race. There are few other fields in the sciences where skillful prediction not only has had immense impact on our society, but is even possible. We should be extraordinarily proud of this achievement.
The current expulsion of primarily younger NOAA employees without cause and with disturbingly short notice is cruel to them personally and professionally. The youngest employees are the future of any organization, government or otherwise, and bring with them unique energy, skills, and ideas. Every government organization should strive to become more efficient, and must be subjected to careful oversight, since taxpayer funding is precious and entrusted to the government by the people. However, the instrument of wise oversight is the scalpel, not the chainsaw. The recent seemingly arbitrary and capricious reductions, notably made without Congressional oversight, are seriously jeopardizing the future of the country and more generally the property and lives of hundreds of millions of tax-paying families who have invested in these truly remarkable achievements over many decades.
References:
“Evolving the National Weather Service to Build a Weather-Ready Nation: Connecting
Observations, Forecasts, and Warnings to Decision-Makers through Impact-Based Decision
Support Services”, Bulletin of the American Meteorological Society, October 2019.
“Using the National Weather Service’s impact-based decision support services to prepare for
extreme winter storms“, Journal of Emergency Management, November/December 2019.
“Impact-Based Decision Support Services (IDSS) and Socioeconomic Impacts of Winter Storms”,
Bulletin of the American Meteorological Society, May 2020.
“Communicating Forecast Uncertainty (CoFU) 2: Replication and Extension of a Survey of the US
Public’s Sources, Perceptions, Uses, and Values for Weather Information.” American
Meteorological Society Policy Program Study, September 2024.
“The Social Value of Hurricane Forecasts”, SSRN Journal, December 2024.
Science is not value free
An interesting commentary addressing a rather odd prior commentary makes some very correct points.
[Read more…] about Science is not value freeScience denial is still an issue ahead of COP28
It is 33 years now since the IPCC in its first report in 1990 concluded that it is “certain” that greenhouse gas emissions from human activities “will enhance the greenhouse effect, resulting on average in an additional warming of the Earth’s surface.” That has indeed happened as predicted, it has been confirmed by a zillion studies and has been scientific consensus for decades. Yet, when the next global climate summit is coming up (it’s starting tomorrow), we don’t only learn that the host, United Arab Emirates, intends to use the event for new oil deals. We also see more attempts to cast doubt that global warming is caused by emissions from burning oil, gas and coal – as so often before these summits.
This time making the rounds is a “discussion paper” published by Statistics Norway. It is noteworthy not because it contains anything new (it doesn’t), but because despite clearly violating the established standards of good scientific practice, it was published by a government agency. That’s why it is having an impact in non-scientific quarters including the corporate world, and it has even been cited in a submission to proceedings of the German parliament.
The flood of fallacies or deceptions begins with the paper’s title: “To what extent are temperature levels changing due to greenhouse gas emissions?” But the effect of greenhouse gases is not even investigated in the paper – which suggests the title is politically motivated. And the paper revolves around ignoring past studies and basic physics, using dubious sources, and the glaring blunder of arguing that warming at any individual weather station might be caused by random weather variations, without ever wondering how it is possible that these supposed random variations go in the same direction all over the planet: in the direction of warming.
The paper provides a good opportunity to illustrate how climate science obfuscation works, and to remind readers how we actually know for sure that greenhouse gas emissions are indeed responsible for modern global warming.
Egregious scientific errors
The paper contains far too many egregious scientific errors and logical fallacies to review here, but let’s look at one: The paper continually mixes up local and global temperatures. It performs some statistical analysis on local temperature changes and argues they individually might just be within random fluctuations (a 25-year-old argument, which works if you assume long autocorrelation) – but even if that were true, the same does not apply to the global temperature. In an unchanging climate, the random fluctuations would lead to warming in some parts of the world and cooling in others. The fact that all parts of the world, with very few exceptions, show warming at the same time cannot be explained by random internal fluctuations.
It’s not hard to understand. In a world with just random local fluctuations but no climate change, about half the weather stations would show a (more or less significant) warming, the other half a cooling. With a modest amount of global warming, perhaps 60% would be warming and 40% cooling. With strong global warming, close to 100% will show warming, and that is exactly what is happening. It shows global warming has overwhelmed natural temperature variability, and that is what the Statistics Norway paper confirms yet again. Its authors literally don’t see the forest for the trees when they falsely claim the opposite.
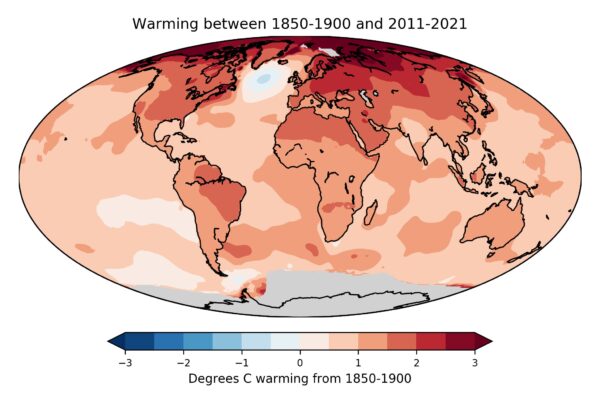
Figure 1: Map of observed near-surface air temperature changes since the late 19th Century. Gray areas show lack of data. The only region of cooling is the northern Atlantic, where climate models have long predicted just that due to a slowing of the Atlantic Ocean overturning circulation. The data are from the independent open-source Berkeley Earth project – a project by the formerly outspoken climate skeptic physicist Richard Muller, which in 2010 set out to do better than the traditional climate institutes and in the end obtained almost exactly the same results, just a slightly faster global warming. Muller was converted to accepting mainstream climate science by his own results. Image: Zeke Hausfather / Berkeley Earth.
Such statistics have of course been investigated for other climate parameters, too. For extreme rainfall events, a study of a global dataset of 8326 high-quality weather stations found that “64% of stations show increasing trends and 36% show decreasing trends”. Another study has shown the same for 940 Western European weather stations. That confirms that extreme rainfall is increasing – as predicted by elementary physics as well as climate models.
Blind use of statistics without understanding physics
Perhaps the most important law of physics is the conservation of energy, and the observed warming of Earth requires a huge energy input, which cannot be provided by random weather fluctuations. But even first-term physics is completely ignored in the Statistics Norway paper.
The heating of the global ocean has been going on at a steady rate of nine zeta Joules per year for decades, which is 15 times the worldwide primary energy consumption. We know this from the thousands of Argo floats drifting in the oceans, regularly diving down to 2000 meters while taking measurements. And we know where this staggering amount of heat energy comes from: It represents 91% of the additional heat retained on our planet by the human-caused increase in greenhouse gases. The energy balance of our planet, the radiation arriving and leaving, is continually monitored by a global radiation network at the surface and by dedicated satellites.
The greenhouse effect is in fact the largest control knob to dial up the temperature of our planet. We are receiving 342 Watts per square meter of Earth surface in back-radiation from the greenhouse effect, which is more than twice the Sun’s energy absorbed at Earth’s surface. And yes, also the increase in back-radiation towards the Earth surface from the CO2 greenhouse effect is a measured fact.
The physics behind the greenhouse effect and the gases that cause it have been understood since the 1800s, and that is why global warming was correctly predicted since the 1970s, even before observations unequivocally showed it. This warming was predicted not only by independent university and government scientists, but also by scientists from the oil company Exxon.
Is it sheer incompetence or is it politically motivated?
So the Statistics Norway paper ignores physics, misinterprets statistics and cherry-picks data – but is that just sheer incompetence, or is it politically motivated? In addition to the title, there are many tell-tale signs that strongly suggest the latter. Here’s just a few examples.
The paper shows a graph of local Greenland temperature from the famous Camp Century ice core drilled in 1960-1966. But rather than the data from the original publication in Science, it shows a hand-drawn version that has never been published in the peer-reviewed literature and is mislabeled, with the vertical axis showing variations around an average temperature of 15 °C (rather than -25 °C) to suggest it represents the global mean. This version originates from a 1995 German book and to this day is highly popular with the climate skeptics bubble on social media, and with the German right-wing AfD climate denial party (see my 2019 blog article).
The Statistics Norway authors try to cast doubt on modern warming being human-caused by pointing to the fact that Greenland was warmer during past millennia. But they don’t tell you why: as explained for example in the paleoclimate chapter of the 4th IPCC report of 2007 (which I co-authored), this is as expected from Earth’s natural orbital cycles. And they conveniently ignore global data reconstructions, which show Earth is warmer now than any time at least since the last Ice Age 24.000 years ago.
Similarly, they show Antarctic ice core data, taken from the climate skeptic website climate4you rather than a scientific source, with the figure caption falsely claiming that these data show global temperature when in fact, it is local. Greenland and Antarctica are perhaps the two locations on Earth where temperature variations are least representative of the global average.
The statistical analysis in fact confirms climate change
The paper analyses only one temperature data set which is actually global: the HadCRUT3 data, one of the well-established global temperature series. Strangely, the data shown end in December 2010 and the diagram is copied from the same climate skeptic website, instead of using the current HadCRUT5 data which have improved global coverage and are readily available from the source (which google finds in one second). But regardless: for this data set even their method “found that the HadCRUT3 time series is far from stationary”. The real result of their statistical analysis is thus: global temperature does show climate change! They even wonder why it does that, despite their home-baked aggregate of a small number of weather stations does not even though it shows a similar trend. They don’t seem to understand that the signal-to-noise ratio matters, which is worse the fewer data one uses (they used a meagre 74 stations).
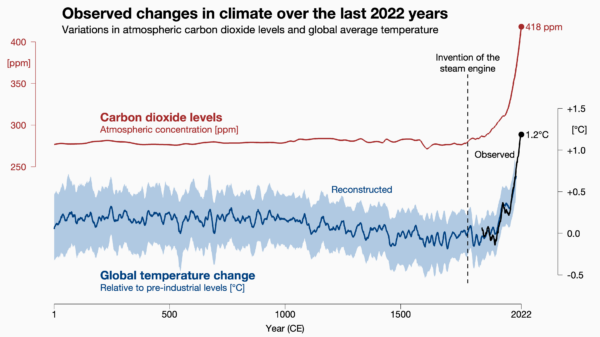
Figure 2: Carbon dioxide levels and global temperature over the past 2022 years. Carbon dioxide data from air bubbles enclosed in Antarctic ice. Global temperature data from the PAGES2k project, a collaboration of 78 paleo-climatologists from 24 countries. The Statistics Norway paper conveniently ignored these well-known state-of-the art data, even though they are shown in the IPCC report. Image: Prof. Ed Hawkins, National Centre for Atmospheric Science.
Unscientific sources
The paper also repeatedly cites a climate skeptics book by Fritz Vahrenholt and Sebastian Lüning, a former German CEO and an employee of the energy giant RWE, the largest CO2 emitter in Europe. The US edition of this book, called The Neglected Sun, is published by the climate denial lobby Heartland Institute. Yes, that’s the think tank which ran a poster campaign comparing the Unabomber and Osama Bin Laden to those concerned about global warming.
The original German title of this book is called Die kalte Sonne (The Cold Sun), referring to the fact that solar activity has declined, and thus has counteracted a small amount of the greenhouse warming caused by burning coal, oil and gas. This book badly overestimated the importance of solar variations and thus predicted an imminent global cooling. When this was soon disproven by observations, they accused NASA of doctoring the data.
I could go on. The paper presents many more hair-raising false statements and misleading climate-change-denial talking points. The authors have clearly swallowed a great mouthful of the toxic brew found on climate denial websites. But they have apparently not bothered to look at real climate science or talk to a climate scientist before publishing this “discussion paper”.
A massive blow to Statistics Norway’s credibility
It is more than embarrassing that Statistics Norway has published this nonsense. It is a scandal. Let’s hope it was not political on the part of that institution, but just a bad mistake. If they want to salvage their reputation and credibility, they should withdraw it immediately, with an appropriate explanation of the real science of global warming.
The Scafetta Saga
It has taken 17 months to get a comment published pointing out the obvious errors in the Scafetta (2022) paper in GRL.
Back in March 2022, Nicola Scafetta published a short paper in Geophysical Research Letters (GRL) purporting to show through ‘advanced’ means that ‘all models with ECS > 3.0°C overestimate the observed global surface warming’ (as defined by ERA5). We (me, Gareth Jones and John Kennedy) wrote a note up within a couple of days pointing out how wrongheaded the reasoning was and how the results did not stand up to scrutiny.
[Read more…] about The Scafetta SagaReferences
- N. Scafetta, "Advanced Testing of Low, Medium, and High ECS CMIP6 GCM Simulations Versus ERA5‐T2m", Geophysical Research Letters, vol. 49, 2022. http://dx.doi.org/10.1029/2022GL097716