I’ve been interested in indirect climate-related datasets for a while (for instance, the Nenana Ice Classic). One that I was reminded of yesterday is the 48-year series of openings and closings of the Rideau Canal Skateway in Ottawa.
IPCC Communication handbook
A new handbook on science communication came out from IPCC this week. Nominally it’s for climate science related communications, but it has a wider application as well. This arose mainly out of an “Expert meeting on Communication” that IPCC held in 2016.
6 principles to help IPCC scientists better communicate their work
There was a Guardian article on it as well.
The six principles are pretty straightforward:
- Be a confident communicator
- Talk about the real world, not abstract ideas
- Connect with what matters to your audience
- Tell a human story
- Lead with what you know
- Use the most effective visual communication
Each is supported with references to the relevant literature and with climate-related (“real world”) examples that are themselves confidently communicated with effective visuals.
But what do people think? Is this a useful addition to the literature on communication? Anything you think doesn’t work? or that perhaps surprises you?
PS. I’m perhaps a little biased because they use a Peter Essick photo for their cover art that was also in my book.
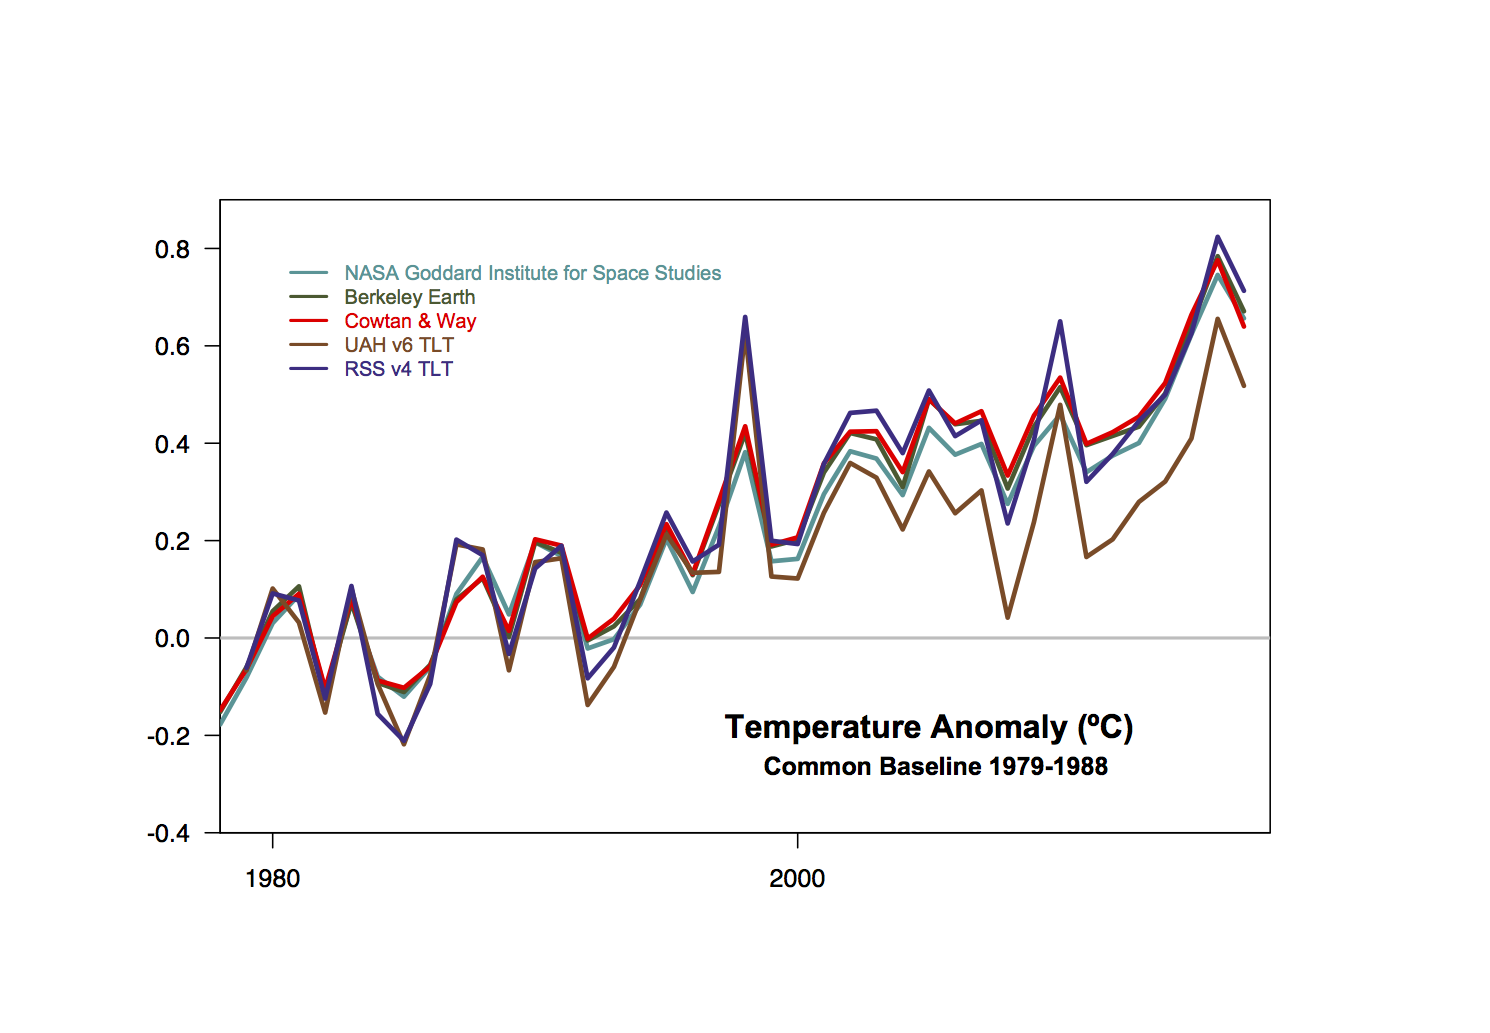
2017 temperature summary
This is a thread to discuss the surface temperature records that were all released yesterday (Jan 18). There is far too much data-vizualization on this to link to, but feel free to do so in the comments. Bottom line? It’s still getting warmer.
[Update: the page of model/observational data comparisons has now been updated too.]
What did NASA know? and when did they know it?
If you think you know why NASA did not report the discovery of the Antarctic polar ozone hole in 1984 before the publication of Farman et al in May 1985, you might well be wrong.
One of the most fun things in research is what happens when you try and find a reference to a commonly-known fact and slowly discover that your “fact” is not actually that factual, and that the real story is more interesting than you imagined…
[Read more…] about What did NASA know? and when did they know it?
References
- J.C. Farman, B.G. Gardiner, and J.D. Shanklin, "Large losses of total ozone in Antarctica reveal seasonal ClOx/NOx interaction", Nature, vol. 315, pp. 207-210, 1985. http://dx.doi.org/10.1038/315207a0
O Say can you See Ice…
Some concerns about continued monitoring of sea ice by remote sensing were raised this week in Nature News an article in the (UK) Observer: Donald Trump accused of obstructing satellite research into climate change. The last headline is not really correct, but the underlying issues are real.
…the Harde they fall.
Back in February we highlighted an obviously wrong paper by Harde which purported to scrutinize the carbon cycle. Well, thanks to a crowd sourced effort which we helped instigate, a comprehensive scrutiny of those claims has just been published. Lead by Peter Köhler, this included scientists from multiple disciplines working together to clearly report on the mistaken assumptions in the Harde paper.
The comment is excellent, and so should be well regarded, but the fact that it is a comment means that the effort will likely be sorely underappreciated. Part of problem is the long time for the process (almost 8 months) which means that the nonsense is mostly forgotten about by the time the comments are published. We’ve discussed trying to speed up and improve the process by having a specialized journal for comments and replications but really the problem here is the low quality of peer review and editorial supervision that allows these pre-rebunked papers to appear in the first place.
GPC is not the only (nor the worst) culprit for this kind of nonsense – indeed we just noticed a bunch of astrology papers in the International Journal of Heat and Technology (by Nicola Scatetta [natch]). It does seem to demonstrate that truly you can indeed publish anything somewhere.
References
- P. Köhler, J. Hauck, C. Völker, D.A. Wolf-Gladrow, M. Butzin, J.B. Halpern, K. Rice, and R.E. Zeebe, "Comment on “ Scrutinizing the carbon cycle and CO 2 residence time in the atmosphere ” by H. Harde", Global and Planetary Change, vol. 164, pp. 67-71, 2018. http://dx.doi.org/10.1016/j.gloplacha.2017.09.015
Data rescue projects
It’s often been said that while we can only gather new data about the planet at the rate of one year per year, rescuing old data can add far more data more quickly. Data rescue is however extremely labor intensive. Nonetheless there are multiple data rescue projects and citizen science efforts ongoing, some of which we have highlighted here before. For those looking for an intro into the subject, this 2014 article is an great introduction.
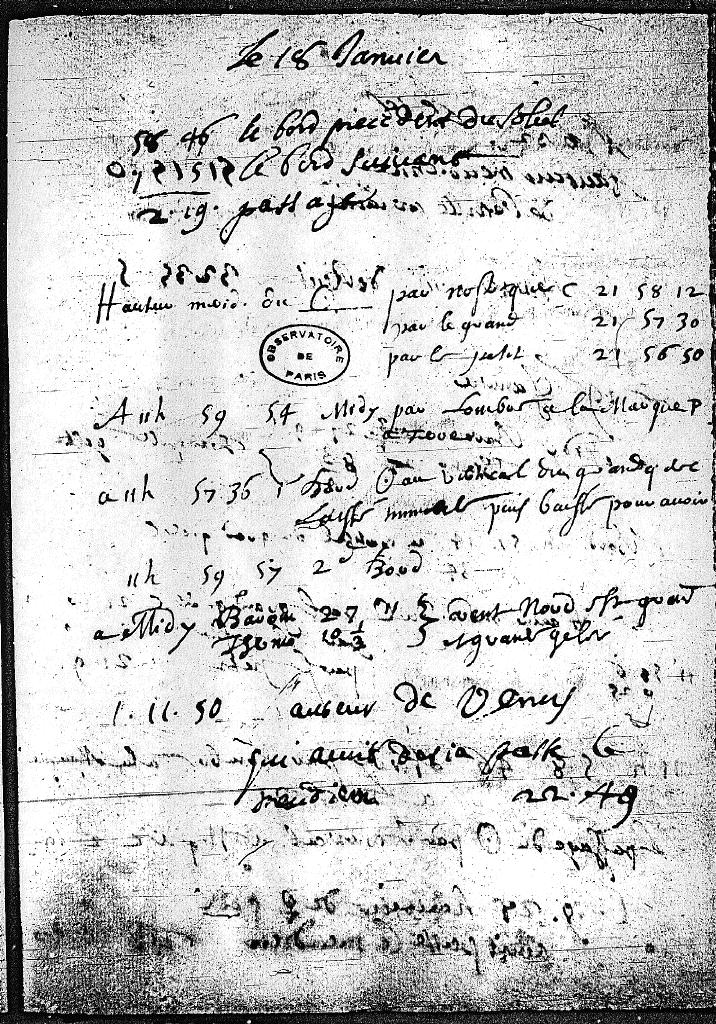
Weather diary from the the Observatoire de Paris, written by Giovanni Cassini on 18th January 1789.
I was asked this week whether there was a list of these projects, and with a bit of help from Twitter, we came up with the following:
- Old Weather (@oldweather)
- Weather Detective (closing soon)
- Weather Rescue
- NOAA Climate Database Modernization Program
- New Zealand (@DeepSouth_NZ)
- The International Environmental Data Rescue Organization (IEDRO)
- Atmospheric Circulation Reconstruction over the Earth (@met_acre)
- The International Data Rescue Portal (i-Dare)
- Met Éirann (poster)
- Historical Climatology (list of more databases)
- Data Rescue at home
- Historical Canadian data
- SE Australia Recent Climate History (no longer active?)
- Congo basin eco-climatological data recovery and valorisation (COBECORE)
- The climate and environmental history collaborative research environment (Tambora)
(If you know of any more, please add them in the comments, and I’ll try and keep this list up to date).
Observations, Reanalyses and the Elusive Absolute Global Mean Temperature
One of the most common questions that arises from analyses of the global surface temperature data sets is why they are almost always plotted as anomalies and not as absolute temperatures.
There are two very basic answers: First, looking at changes in data gets rid of biases at individual stations that don’t change in time (such as station location), and second, for surface temperatures at least, the correlation scale for anomalies is much larger (100’s km) than for absolute temperatures. The combination of these factors means it’s much easier to interpolate anomalies and estimate the global mean, than it would be if you were averaging absolute temperatures. This was explained many years ago (and again here).
Of course, the absolute temperature does matter in many situations (the freezing point of ice, emitted radiation, convection, health and ecosystem impacts, etc.) and so it’s worth calculating as well – even at the global scale. However, and this is important, because of the biases and the difficulty in interpolating, the estimates of the global mean absolute temperature are not as accurate as the year to year changes.
This means we need to very careful in combining these two analyses – and unfortunately, historically, we haven’t been and that is a continuing problem.
[Read more…] about Observations, Reanalyses and the Elusive Absolute Global Mean Temperature
Joy plots for climate change
 This is joy as in ‘Joy Division’, not as in actual fun.
Many of you will be familiar with the iconic cover of Joy Division’s Unknown Pleasures album, but maybe fewer will know that it’s a plot of signals from a pulsar (check out this Scientific American article on the history). The length of the line is matched to the frequency of the pulsing so that successive pulses are plotted almost on top of each other. For many years this kind of plot did not have a well-known designation until, in fact, April this year:
I hereby propose that we call these "joy plots" #rstats https://t.co/uuLGpQLAwY
— Jenny Bryan (@JennyBryan) April 25, 2017
So “joy plots” it is.
Climate Sensitivity Estimates and Corrections
You need to be careful in inferring climate sensitivity from observations.
Two climate sensitivity stories this week – both related to how careful you need to be before you can infer constraints from observational data. (You can brush up on the background and definitions here). Both cases – a “Brief Comment Arising” in Nature (that I led) and a new paper from Proistosescu and Huybers (2017) – examine basic assumptions underlying previously published estimates of climate sensitivity and find them wanting.
[Read more…] about Climate Sensitivity Estimates and Corrections
References
- C. Proistosescu, and P.J. Huybers, "Slow climate mode reconciles historical and model-based estimates of climate sensitivity", Science Advances, vol. 3, 2017. http://dx.doi.org/10.1126/sciadv.1602821