For the last few years (since at least 2016), I’ve shared predictions for the next annual global mean surface air temperature (GMSAT) anomaly based on the long term trend and the state of ENSO at the start of the year. Generally speaking, this has been quite skillful compared to persistence or just the long term trend alone – the eventual anomaly was consistently within the predicted bounds. Until 2023.
[Read more…] about Annual GMSAT predictions and ENSOClimate modelling
Clauser-ology: Cloudy with a chance of meatballs
John Clauser’s theory of climate explained.

Some of you will have heard of John Clauser because he was an awardee of the 2022 Nobel Prize in Physics for his role in the experimental verification of quantum entanglement. Some of you will have heard of him because the first thing that he did after winning the Nobel was join a climate denial organization and make some rather odd claims about climate science. And some of you will never have heard of him (in which case, feel free to skip this post!).
At no point in his long and, by all accounts, successful, career has he ever published a paper on climate[1]. He has not penned an article, nor even a blog post or a tweet on the topic, and so any scientific basis for his opinions (if any) has been opaque… until recently. In the last few months he has given two interviews in which he goes into to detail about what he describes as a ‘missing element’ in climate science and what he imagines the consequences are for climate change. The first interview was for the Epoch Times (a far right-wing newspaper and media organization affiliated with Falun Gong). The second was a podcast with the somewhat troubled Chris Smith, an Australian journalist. (The material is somewhat similar in each). And more comprehensively, it was repeated in a recent video lecture as well.
And what is this supposed ‘missing element’? Clouds.
[Read more…] about Clauser-ology: Cloudy with a chance of meatballsThe 5th International Conference on Regional Climate
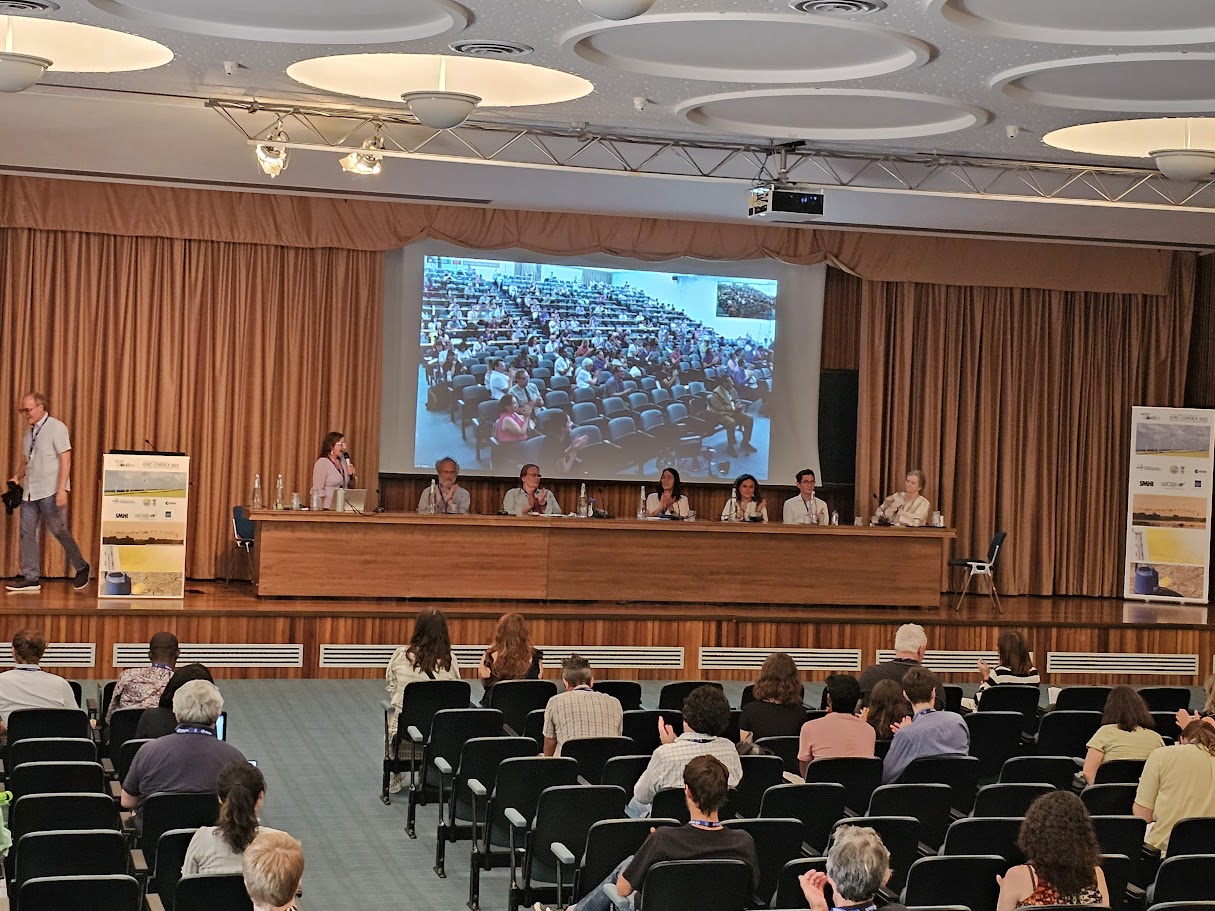
The fifth international conference on regional climate (ICRC 2023), organised by World Climate Research Programme’s (WCRP) coordinated downscaling experiment (CORDEX), has just completed. It was a hybrid on-site/online conference with hubs in both Trieste/Italy (hosted by the International Centre on Theoretical Physics, ICTP) and Pune/India.
The hybrid set-up, with video links between the two hubs and digital attendence through zoom, was a change from previous ICRCs held in ICTP (2011), Brussels (2013), Stockholm (2016), and Beijing (2019). It worked impressively well, and the CORDEX ICRC 2023 streaming is available from the WCRP CORDEX YouTube channel.
It seems as an eternity since the previous ICRC before the COVID pandemic, so I was curious to see how things have progressed since then. It was also interesting to compare my impressions from this conference with my blog posts here on RealClimate from the first ICRC in Trieste, the second in Brussels, the third ICRC in Stockholm, I see that questions concerning uncertainty and added value are still being debated.
The Scafetta Saga
It has taken 17 months to get a comment published pointing out the obvious errors in the Scafetta (2022) paper in GRL.
Back in March 2022, Nicola Scafetta published a short paper in Geophysical Research Letters (GRL) purporting to show through ‘advanced’ means that ‘all models with ECS > 3.0°C overestimate the observed global surface warming’ (as defined by ERA5). We (me, Gareth Jones and John Kennedy) wrote a note up within a couple of days pointing out how wrongheaded the reasoning was and how the results did not stand up to scrutiny.
[Read more…] about The Scafetta SagaReferences
- N. Scafetta, "Advanced Testing of Low, Medium, and High ECS CMIP6 GCM Simulations Versus ERA5‐T2m", Geophysical Research Letters, vol. 49, 2022. http://dx.doi.org/10.1029/2022GL097716
As Soon as Possible
The latest contrarian crowd pleaser from Soon et al (2023) is just the latest repetition of the old “it was the sun wot done it” trope[1] that Willie Soon and his colleagues have been pushing for decades. There is literally nothing new under the sun.
[Read more…] about As Soon as PossibleReferences
- W. Soon, R. Connolly, M. Connolly, S. Akasofu, S. Baliunas, J. Berglund, A. Bianchini, W. Briggs, C. Butler, R. Cionco, M. Crok, A. Elias, V. Fedorov, F. Gervais, H. Harde, G. Henry, D. Hoyt, O. Humlum, D. Legates, A. Lupo, S. Maruyama, P. Moore, M. Ogurtsov, C. ÓhAiseadha, M. Oliveira, S. Park, S. Qiu, G. Quinn, N. Scafetta, J. Solheim, J. Steele, L. Szarka, H. Tanaka, M. Taylor, F. Vahrenholt, V. Velasco Herrera, and W. Zhang, "The Detection and Attribution of Northern Hemisphere Land Surface Warming (1850–2018) in Terms of Human and Natural Factors: Challenges of Inadequate Data", Climate, vol. 11, pp. 179, 2023. http://dx.doi.org/10.3390/cli11090179
Evaluation of GCM simulations with a regional focus.
Do the global climate models (GCMs) we use for describing future climate change really capture the change and variations in the region that we want to study? There are widely used tools for evaluating global climate models, such as the ESMValTool, but they don’t provide the answers that I seek.
I use GCMs to provide information about large-scale conditions, processes and phenomena in the atmosphere that I can use as predictors in downscaling future climate projections. I also want to know whether the ensemble of GCM simulations that I use provides representative statistics of the actual regional climate I’m interested in.
[Read more…] about Evaluation of GCM simulations with a regional focus.CMIP6: Not-so-sudden stratospheric cooling
As predicted in 1967 by Manabe and Wetherald, the stratosphere has been cooling.
A new paper by Ben Santer and colleagues has appeared in PNAS where they extend their previous work on the detection and attribution of anthropogenic climate change to include the upper stratosphere, using observations from the Stratospheric Sounding Units (SSUs) (and their successors, the AMSU instruments) that have flown since 1979.
[Read more…] about CMIP6: Not-so-sudden stratospheric coolingReferences
- B.D. Santer, S. Po-Chedley, L. Zhao, C. Zou, Q. Fu, S. Solomon, D.W.J. Thompson, C. Mears, and K.E. Taylor, "Exceptional stratospheric contribution to human fingerprints on atmospheric temperature", Proceedings of the National Academy of Sciences, vol. 120, 2023. http://dx.doi.org/10.1073/pnas.2300758120
Some new CMIP6 MSU comparisons
We add some of the CMIP6 models to the updateable MSU [and SST] comparisons.
After my annual update, I was pointed to some MSU-related diagnostics for many of the CMIP6 models (24 of them at least) from Po-Chedley et al. (2022) courtesy of Ben Santer. These are slightly different to what we have shown for CMIP5 in that the diagnostic is the tropical corrected-TMT (following Fu et al., 2004) which is a better representation of the mid-troposphere than the classic TMT diagnostic through an adjustment using the lower stratosphere record (i.e.  ).
).
References
- S. Po-Chedley, J.T. Fasullo, N. Siler, Z.M. Labe, E.A. Barnes, C.J.W. Bonfils, and B.D. Santer, "Internal variability and forcing influence model–satellite differences in the rate of tropical tropospheric warming", Proceedings of the National Academy of Sciences, vol. 119, 2022. http://dx.doi.org/10.1073/pnas.2209431119
- Q. Fu, C.M. Johanson, S.G. Warren, and D.J. Seidel, "Contribution of stratospheric cooling to satellite-inferred tropospheric temperature trends", Nature, vol. 429, pp. 55-58, 2004. http://dx.doi.org/10.1038/nature02524
How not to science
A trip down memory lane and a lesson on scientific integrity.
I had reason to be reviewing the history of MSU satellite retrievals for atmospheric temperatures recently. It’s a fascinating story of technology, creativity, hubris, error, imagination, rivalry, politics, and (for some) a search for scientific consilience – worthy of movie script perhaps? – but I want to highlight a minor little thing. Something so small that I’d never noticed it before, and I don’t recall anyone else pointing it out, but it is something I find very telling.
The story starts in the early 90’s, but what caught my eye was a single line in an op-ed (sub. req.) written two decades later:
… in 1994 we published an article in the journal Nature showing that the actual global temperature trend was “one-quarter of the magnitude of climate model results.”McNider and Christy, Feb 19th 2014, Wall Street Journal
Most of the op-ed is a rather tired rehash of faux outrage based on a comment made by John Kerry (the then Secretary of State) and we can skip right past that. It’s only other claim of note is a early outing of John Christy’s misleading graphs comparing the CMIP5 models to the satellite data but we’ll get back to that later.
First though, let’s dig into that line. The 1994 article is a short correspondence piece in Nature, where Christy and McNider analyzed MSU2R lower troposphere dataset and using ENSO and stratospheric volcanic effects to derive an ‘underlying’ global warming trend of 0.09 K/decade. This was to be compared with “warming rates of 0.3 to 0.4 K/decade” from models which was referenced to Manabe et al. (1991) and Boer et al. (1992). Hence the “one quarter” claim.
But lets dig deeper into each of those elements in turn. First, 1994 was pretty early on in terms of MSU science. The raw trend in the (then Version C) MSU2R record from 1979-1993 was -0.04 K/decade. [Remember ‘satellite cooling’?]. This was before Wentz and Schabel (1998) pointed out that orbital decay in the NOAA satellites was imparting a strong cooling bias (about 0.12 K/decade) on the MSU2R (TLT) record. Secondly, the two cited modeling papers don’t actually give an estimated warming trends for the 1980s and early 90s. The first is a transient model run using a canonical 1% increasing CO<sub>2</sub> – a standard experiment, but not one intended to match the real world growth of CO2 concentrations. The second model study is a simple equilibrium 2xCO2 run with the Canadian climate model, and does not report relevant transient warming rates at all. This odd referencing was pointed out in correspondence with Spencer and Christy by Hansen et al. (1995) who also noted that underlying model SAT trends for the relevant period were expected to be more like 0.1-0.15 K/decade. So the claim that the MSU temperatures were warming at “one quarter” the rate of the models wasn’t even valid in 1994. They might have more credibly claimed “two thirds” the rate, but the uncertainties are such that no such claim would have been robust (for instance, just the uncertainties on the linear regression alone are ~ +/-0.14 K/dec).
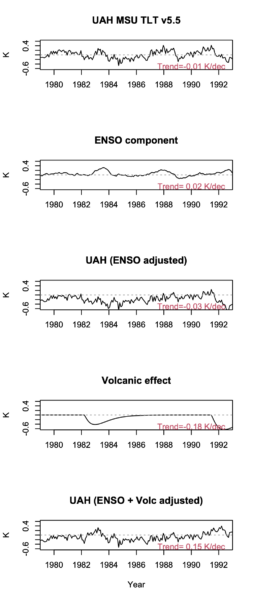
But it gets worse. In 2014, McNider and Christy were well aware of the orbital decay correction (1998), and they were even aware of the diurnal drift correction that was needed because of a sign error introduced while trying to fix the orbital decay issue (discovered in 2005). The version of the MSU2R product at the beginning of 2014 was version 5.5, and that had a raw trend of -0.01 K/decade 1979-1993 (+/- 0.18 K/dec 95% CI, natch). Using an analogous methodology to that used in 1994 (see figure to the right), the underlying linear trend after accounting for ENSO and volcanic aerosols was…. 0.15 K/dec! Almost identical to the expected trend from models!
So not only was their original claim incorrect at the time, but had they repeated the analysis in 2014, their own updated data and method would have shown that there was no discrepancy at all.
Now in 2014, there was a longer record and more suitable models to compare to. Models had been run with appropriate volcanic forcings and in large enough ensembles that there was a quantified spread of expected trends. Comparisons could now be done in a more sophisticated away, that compared like with like and took account of many different elements of uncertainty (forcings, weather, structural effects in models and observations etc.). But McNider and Christy chose not to do that.
Instead, they chose to hide the structural uncertainty in the MSU retrievals (the TMT trends for 1979-2013 in UAH v5.5 and RSS v3.3 were 0.04 and 0.08 +/- 0.05 K/dec respectively – a factor of two different!), and ignore the spread in the CMIP5 models TMT trends [0.08,0.36] and graph it in a way as to maximise the visual disparity in a frankly misleading way. Additionally, they decided to highlight the slower warming TMT records instead of the TLT record they had discussed in 1994. For contrast, the UAH v5.5 TLT trends for 1979-2013 were 0.14± 0.05 K/dec.
But all these choices were made in the service of rhetoric, not science, to suggest that models are, and had always been, wrong, and that the UAH MSU data had always been right. A claim moreover that is totally backwards.
Richard Feynman often spoke about a certain kind of self-critical integrity as being necessary to do credible science. That kind of integrity was in very short supply in this op-ed.
References
- J.R. Christy, and R.T. McNider, "Satellite greenhouse signal", Nature, vol. 367, pp. 325-325, 1994. http://dx.doi.org/10.1038/367325a0
- F.J. Wentz, and M. Schabel, "Effects of orbital decay on satellite-derived lower-tropospheric temperature trends", Nature, vol. 394, pp. 661-664, 1998. http://dx.doi.org/10.1038/29267
- J. Hansen, H. Wilson, M. Sato, R. Ruedy, K. Shah, and E. Hansen, "Satellite and surface temperature data at odds?", Climatic Change, vol. 30, pp. 103-117, 1995. http://dx.doi.org/10.1007/BF01093228
2022 updates to model-observation comparisons
Our annual post related to the comparisons between long standing records and climate models.
As frequent readers will know, we maintain a page of comparisons between climate model projections and the relevant observational records, and since they are mostly for the global mean numbers, these get updated once the temperature products get updated for the prior full year. This has now been completed for 2022.
[Read more…] about 2022 updates to model-observation comparisons