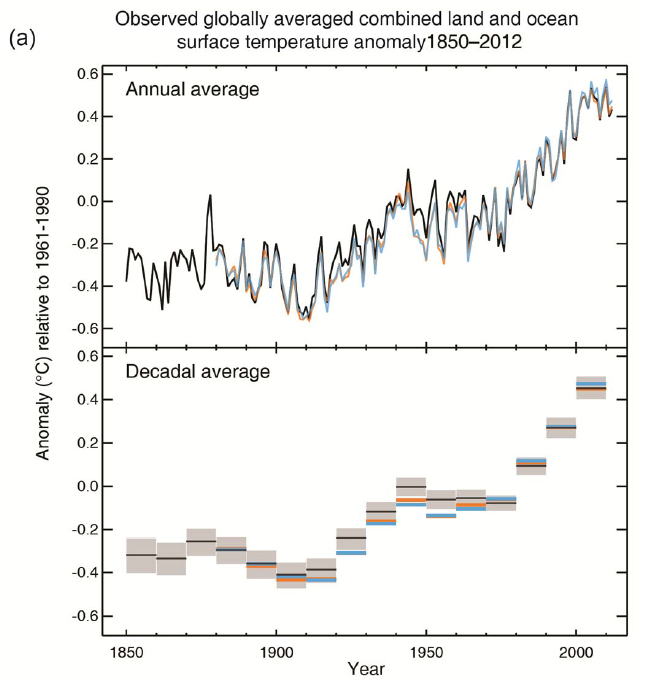
• Skip to primary navigation
  • Skip to main content
  • Skip to primary sidebar
  • Skip to footer

RealClimate

Climate science from climate scientists...

  • Start here
  • Model-Observation Comparisons
  • Miscellaneous Climate Graphics
  • Surface temperature graphics
You are here: Home / Archives for statistics

statistics

Predicting annual temperatures a year ahead

16 Sep 2016 by Gavin

I have a post at Nate Silver’s 538 site on how we can predict annual surface temperature anomalies based on El Niño and persistence – including a (by now unsurprising) prediction for a new record in 2016 and a slightly cooler, but still very warm, 2017.

[Read more…] about Predicting annual temperatures a year ahead

Filed Under: Climate Science, El Nino, Instrumental Record, statistics

Do regional climate models add value compared to global models?

22 May 2016 by rasmus

2016-05-20 10.08.17

Global climate models (GCM) are designed to simulate earth’s climate over the entire planet, but they have a limitation when it comes to describing local details due to heavy computational demands. There is a nice TED talk by Gavin that explains how climate models work.

We need to apply downscaling to compute the local details. Downscaling may be done through empirical-statistical downscaling (ESD) or regional climate models (RCMs) with a much finer grid. Both take the crude (low-resolution) solution provided by the GCMs and include finer topographical details (boundary conditions) to calculate more detailed information. However, does more details translate to a better representation of the world?

The question of “added value” was an important topic at the International Conference on Regional Climate conference hosted by CORDEX of the World Climate Research Programme (WCRP). The take-home message was mixed on whether RCMs provide a better description of local climatic conditions than the coarser GCMs.

[Read more…] about Do regional climate models add value compared to global models?

Filed Under: Climate impacts, Climate modelling, Climate Science, downscaling, Reporting on climate, statistics

Comparing models to the satellite datasets

7 May 2016 by Gavin

How should one make graphics that appropriately compare models and observations? There are basically two key points (explored in more depth here) – comparisons should be ‘like with like’, and different sources of uncertainty should be clear, whether uncertainties are related to ‘weather’ and/or structural uncertainty in either the observations or the models. There are unfortunately many graphics going around that fail to do this properly, and some prominent ones are associated with satellite temperatures made by John Christy. This post explains exactly why these graphs are misleading and how more honest presentations of the comparison allow for more informed discussions of why and how these records are changing and differ from models.
[Read more…] about Comparing models to the satellite datasets

Filed Under: Climate modelling, Climate Science, El Nino, Greenhouse gases, Instrumental Record, IPCC, Model-Obs Comparisons, statistics

Nenana Ice Classic 2016

23 Apr 2016 by Gavin

Just a quick note since I’ve been tracking this statistic for a few years, but the Nenana Ice Classic tripod went down this afternoon (Apr 23, 3:39 Alaska Standard Time). See the earlier post for what this is and why it says something about the climate (see posts on 2014 and 2015 results).

With this unofficial time, this year places 4th earliest for the breakup of ice in the Tanana river. It is unsurprising that it was early given the exceptional warmth in Alaska this year.

The exact ranking of years depends a little on how one accounts for leap-year and other calendrical effects. The raw date is the 4th earliest, but given that this year is a leap year, it would be the 5th earliest counting Julian days from the start of the year. Tying the season to the vernal equinox is more stable, which again leads to the 4th earliest. But regardless of that detail, and consistent with local climate warming, the ice break-up date have advanced about 7 days over the last century.

As a side bet, I predict (based on previous years) that despite enormous attention in the skeptic-osphere given the Nenana result in 2013 (when it was remarkably late), it won’t be mentioned there this year.

Filed Under: Climate Science, Instrumental Record, statistics

Anti-scientists

9 Feb 2016 by rasmus

Ross McKitrick was so upset about a paper ‘Learning from mistakes in climate research’(Benestad et al., 2015) that he has written a letter of complaint and asked for immediate retraction of the pages discussing his work.

This is an unusual step in science, as most disagreements and debate involve a comment or a response to the original article. The exchange of views, then, provides perspectives from different angles and may enhance the understanding of the problem. This is part of a learning process.

Responding to McKitrick’s letter, however, is a new opportunity to explain some basic statistics, and it’s excellent to have some real and clear-cut examples for this purpose.

[Read more…] about Anti-scientists

References

  1. R.E. Benestad, D. Nuccitelli, S. Lewandowsky, K. Hayhoe, H.O. Hygen, R. van Dorland, and J. Cook, "Learning from mistakes in climate research", Theoretical and Applied Climatology, vol. 126, pp. 699-703, 2015. http://dx.doi.org/10.1007/s00704-015-1597-5

Filed Under: Climate impacts, Climate Science, Scientific practice, skeptics, statistics

Climate Sensitivity Week

22 Mar 2015 by Gavin

Some of you will be aware that there is a workshop on Climate Sensitivity this week at Schloss Ringberg in southern Germany. The topics to be covered include how sensitivity is defined (and whether it is even meaningful (Spoiler, yes it is)), what it means, how it can be constrained, what the different flavours signify etc. There is an impressive list of attendees with a very diverse range of views on just about everything, and so I am looking forward to very stimulating discussions.

[Read more…] about Climate Sensitivity Week

Filed Under: Aerosols, Climate modelling, Climate Science, Greenhouse gases, Instrumental Record, IPCC, Paleoclimate, statistics

Rossby waves and surface weather extremes

10 Jul 2014 by Stefan

A new study by Screen and Simmonds demonstrates the statistical connection between high-amplitude planetary waves in the atmosphere and extreme weather events on the ground.

Guest post by Dim Coumou

There has been an ongoing debate, both in and outside the scientific community, whether rapid climate change in the Arctic might affect circulation patterns in the mid-latitudes, and thereby possibly the frequency or intensity of extreme weather events. The Arctic has been warming much faster than the rest of the globe (about twice the rate), associated with a rapid decline in sea-ice extent. If parts of the world warm faster than others then of course gradients in the horizontal temperature distribution will change – in this case the equator-to-pole gradient – which then could affect large scale wind patterns.

Several dynamical mechanisms for this have been proposed recently. Francis and Vavrus (GRL 2012) argued that a reduction of the north-south temperature gradient would cause weaker zonal winds (winds blowing west to east) and therefore a slower eastward propagation of Rossby waves. A change in Rossby wave propagation has not yet been detected (Barnes 2013) but this does not mean that it will not change in the future. Slowly-traveling waves (or quasi-stationary waves) would lead to more persistent and therefore more extreme weather. Petoukhov et al (2013) actually showed that several recent high-impact extremes, both heat waves and flooding events, were associated with high-amplitude quasi-stationary waves. [Read more…] about Rossby waves and surface weather extremes

References

  1. J.A. Francis, and S.J. Vavrus, "Evidence linking Arctic amplification to extreme weather in mid‐latitudes", Geophysical Research Letters, vol. 39, 2012. http://dx.doi.org/10.1029/2012GL051000
  2. E.A. Barnes, "Revisiting the evidence linking Arctic amplification to extreme weather in midlatitudes", Geophysical Research Letters, vol. 40, pp. 4734-4739, 2013. http://dx.doi.org/10.1002/grl.50880
  3. V. Petoukhov, S. Rahmstorf, S. Petri, and H.J. Schellnhuber, "Quasiresonant amplification of planetary waves and recent Northern Hemisphere weather extremes", Proceedings of the National Academy of Sciences, vol. 110, pp. 5336-5341, 2013. http://dx.doi.org/10.1073/pnas.1222000110

Filed Under: Arctic and Antarctic, Climate Science, Instrumental Record, statistics

The most common fallacy in discussing extreme weather events + Update

25 Mar 2014 by Stefan

Does global warming make extreme weather events worse? Here is the #1 flawed reasoning you will have seen about this question: it is the classic confusion between absence of evidence and evidence for absence of an effect of global warming on extreme weather events. Sounds complicated? It isn’t. I’ll first explain it in simple terms and then give some real-life examples.

The two most fundamental properties of extreme events are that they are rare (by definition) and highly random. These two aspects (together with limitations in the data we have) make it very hard to demonstrate any significant changes. And they make it very easy to find all sorts of statistics that do not show an effect of global warming – even if it exists and is quite large.

Would you have been fooled by this?

[Read more…] about The most common fallacy in discussing extreme weather events + Update

Filed Under: Climate Science, Communicating Climate, statistics

The global temperature jigsaw

17 Dec 2013 by Stefan

Since 1998 the global temperature has risen more slowly than before. Given the many explanations for colder temperatures discussed in the media and scientific literature (La Niña, heat uptake of the oceans, arctic data gap, etc.) one could jokingly ask why no new ice age is here yet. This fails to recognize, however, that the various ingredients are small and not simply additive. Here is a small overview and attempt to explain how the different pieces of the puzzle fit together.

AR5_temp_obs

Figure 1 The global near-surface temperatures (annual values at the top, decadal means at the bottom) in the three standard data sets HadCRUT4 (black), NOAA (orange) and NASA GISS (light blue). Graph: IPCC 2013. [Read more…] about The global temperature jigsaw

Filed Under: Aerosols, Climate modelling, Climate Science, El Nino, Instrumental Record, Oceans, statistics

Statistics and Climate

18 Nov 2013 by rasmus

Do different climate models give different results? And if so, why? The answer to these questions will increase our understanding of the climate models, and potentially the physical phenomena and processes present in the climate system.

We now have many different climate models, many different methods, and get a range of different results. They provide what we call ‘multi-model‘ and ‘multi-method‘ ensembles. But how do we make sense out of all this information?

[Read more…] about Statistics and Climate

Filed Under: Climate Science, Reporting on climate, Scientific practice, statistics

  • « Go to Previous Page
  • Page 1
  • Page 2
  • Page 3
  • Page 4
  • Go to Next Page »

Primary Sidebar

Search

Search for:

Email Notification

get new posts sent to you automatically (free)
Loading

Recent Posts

  • The most recent climate status
  • Unforced variations: May 2025
  • Unforced Variations: Apr 2025
  • WMO: Update on 2023/4 Anomalies
  • Andean glaciers have shrunk more than ever before in the entire Holocene
  • Climate change in Africa

Our Books

Book covers
This list of books since 2005 (in reverse chronological order) that we have been involved in, accompanied by the publisher’s official description, and some comments of independent reviewers of the work.
All Books >>

Recent Comments

  • Piotr on Unforced variations: May 2025
  • William on The most recent climate status
  • Mr. Know It All on Unforced variations: May 2025
  • Piotr on The most recent climate status
  • Nigelj on Unforced variations: May 2025
  • Kevin McKinney on Unforced variations: May 2025
  • Kevin McKinney on The most recent climate status
  • Kevin McKinney on The most recent climate status
  • Kevin McKinney on The most recent climate status
  • Mr. Know It All on The most recent climate status
  • K on Unforced variations: May 2025
  • Tomáš Kalisz on Unforced variations: May 2025
  • Tomáš Kalisz on Unforced variations: May 2025
  • Piotr on Unforced variations: May 2025
  • Piotr on Unforced variations: May 2025
  • Susan Anderson on Unforced variations: May 2025
  • Ken Towe on The most recent climate status
  • Keith Woollard on The most recent climate status
  • Dan on Unforced variations: May 2025
  • Nigelj on The most recent climate status

Footer

ABOUT

  • About
  • Translations
  • Privacy Policy
  • Contact Page
  • Login

DATA AND GRAPHICS

  • Data Sources
  • Model-Observation Comparisons
  • Surface temperature graphics
  • Miscellaneous Climate Graphics

INDEX

  • Acronym index
  • Index
  • Archives
  • Contributors

Realclimate Stats

1,365 posts

11 pages

243,163 comments

Copyright © 2025 · RealClimate is a commentary site on climate science by working climate scientists for the interested public and journalists.