This year’s (2023) tropical cyclone season in the North Atlantic and Caribbean witnessed a relatively high number of named tropical cyclones: 20. In spite of the current El Niño, which tends to give lower numbers. But it appears to follow a historical trend for named tropical cyclones with an increasing number over time.
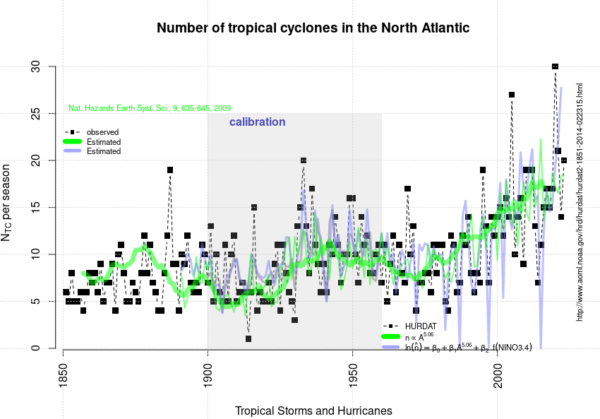
The curve presented above is an update of the analysis presented in 2020 and posted here on RealClimate.
[Read more…] about 2023 appears to follow an upward trend in the North Atlantic/Caribbean named tropical cyclone countReferences
- R.E. Benestad, "On tropical cyclone frequency and the warm pool area", Natural Hazards and Earth System Sciences, vol. 9, pp. 635-645, 2009. http://dx.doi.org/10.5194/nhess-9-635-2009